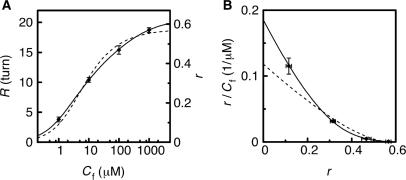
Figure 5.
Direct plot (A) and Scatchard plot (B) of the data derived from the time course of bead revolutions such as that shown in Figure 4. Each data point is the average of four data with SDs. Theoretical curves were the best fits to the data. The fitting parameters were n = 1.60 ± 0.03, K = 1.9 (±0.1) × 105 (M−1), ω = 0.38 ± 0.07 (with cooperativity; the solid lines); n = 1.8 ± 0.1, K = 1.2 (±0.4) × 105 (M−1), ω = 1 (without cooperativity; the broken lines).

