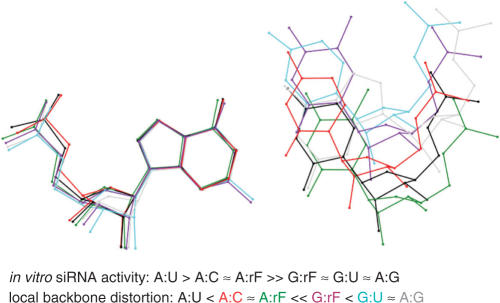
Figure 8.
Comparison between the geometry of various base pairs. The diagram was generated by superimposing the purine bases (A or G, left) of different pairs. Distances between phosphates of residues on the right relative to the phosphate group of U are as follows: A:U (black, base pair A106:U207, FG structure—this article; reference structure), A:rF [green, base pair A21:rF4, 0.79 Å, (41)], G:U [cyan, AR0009, base pair G10:U5, 3.32 Å, (66)], G:rF (purple, base pair G209:rF104, 2.07 Å), A:G (gray, base pair A209:G104, GA structure—this article, 2.97 Å), and A+:C [red, AR0039, base pair A2:C17, 0.79 Å, (78)].

