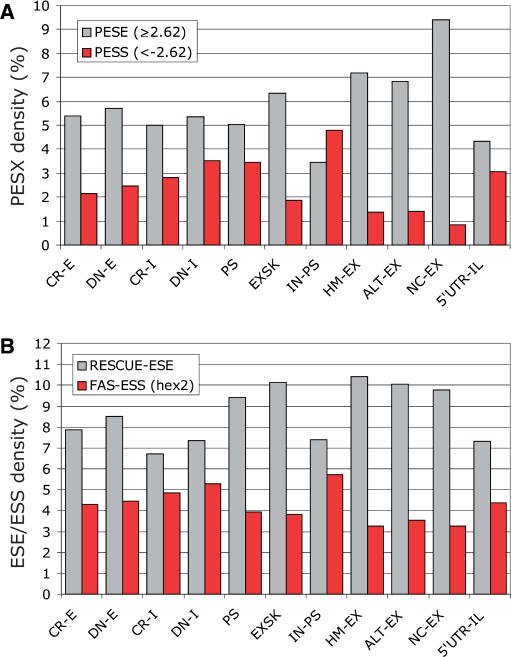
Figure 2.
Density of auxiliary splicing signals in each sequence category. Grey/red bars represent the total number of ESEs/ESSs in each sequence category divided by the total length of sequence group and multiplied by 100. Designation of sequence categories is the same as in Figure 1. (A) Density of PESE and PESS octamers (14). (B) Density of RESCUE-ESEs (13) and FAS-ESSs (32).

