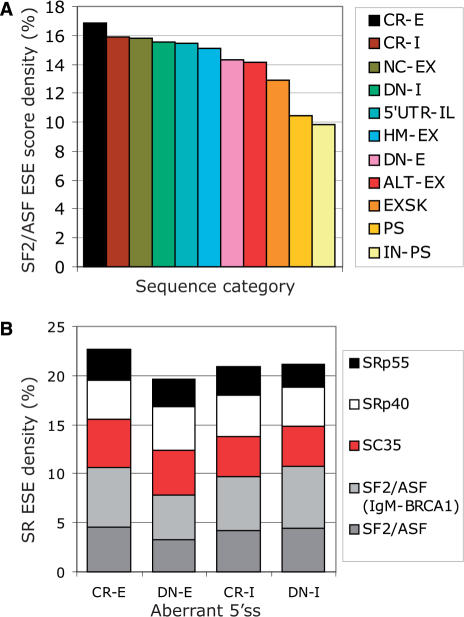
Figure 4.
Control of aberrant splice-site activation by predicted SF2/ASF ESE motifs. (A) A rainbow gradient of SF2/ASF-mediated exon/intron definition. The SF2/ASF ESE score density (IgM-BRCA1 version) was calculated as a sum of SF2/ASF ESE scores in each sequence group, divided by the sequence length and multiplied by 100. Each category is denoted by a colour shown on the right. Sequence categories were ordered from the highest score density to the lowest. For HM-EX and ALT-EX, only 1000 randomly selected sequences were analysed due to size limitations of the server. (B) The SR ESE motif densities in aberrant 5′ss. Each SR protein is represented by a colour shown on the right side.

