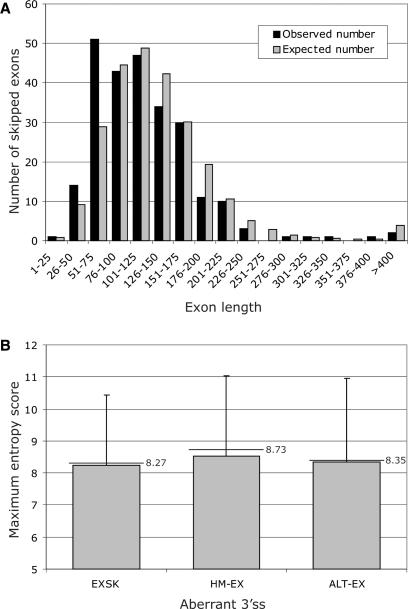
Figure 6.
Exons that were skipped as a result of splicing mutations are shorter than average exons and have weak 3′ss. (A) Length distribution of 250 skipped exons (EXSK). The observed distribution is shown as black bars. The expected distribution (grey bars) was calculated for the same number of exons using exon sizes of 43 244 homologous human-mouse exons (30). (B) Comparison of the intrinsic strength of 3′ss between exons that were skipped as a result of splice-site mutation (EXSK), and conserved (HM-EX) and alternatively spliced exons (ALT-EX). Grey bars represent means; error bars denote standard deviations; horizontal lines with labels are medians.

