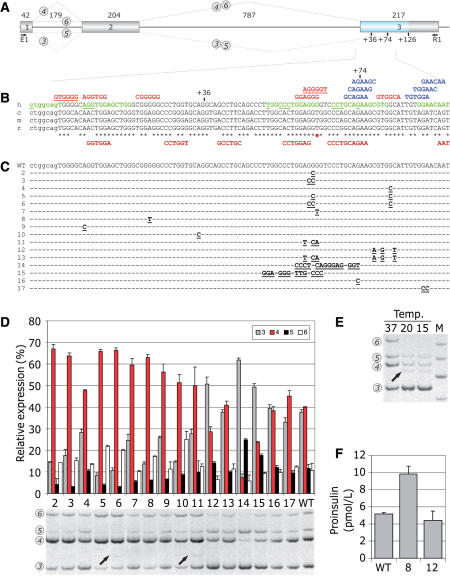
Figure 8.
FAS-ESS-mediated inhibition of authentic 3′ss of INS intron 2 and its effects on proinsulin production. (A) INS construct. Primary transcripts are represented by exons (boxes) and introns (lines). The length of each intron and exon is shown above the primary transcript (in nucleotides). Canonical and alternative splicing is denoted by dotted lines above and below the pre-mRNA, respectively. RNA products containing exon 2 are numbered 3–6 as described previously (20). For simplicity, RNA isoforms 1 and 2 are not shown as they are expressed in very low levels. An exonic segment between two competing 3′ss is shown in blue. (B) Multiple alignment of human (h), chimpanzee (c), mouse (m) and rat (r) sequences and computationally predicted auxiliary splicing elements. Intron 2 is shown in lowercase, exon 3 is in upper case. Black asterisks denote nucleotides shared between the species. A red star shows a G/T variant in a predicted human-specific FAS-ESS. Alternative 3′ss at exon position +36 and +74 are shown by arrows. FAS-ESSs (10,32) are in red, RESCUE-ESEs (13,31) are in blue, PESEs (14) are in green and putative ESRs (16) are in brown below the sequence. The first nucleotide of octamer PESEs with the P and I scores above 2.88 (14) are underlined. The FAS-ESS hex3 set (10,32) is underlined in red. (C) Nucleotide sequences of the wild-type (WT) and mutated (2–17) splicing reporter constructs. Mutations are in bold and underlined. Nucleotides identical to the wild-type are denoted by a dash. (D) Relative expression of exon 2-containing INS mRNA isoforms. The splicing pattern of the WT and mutated (lanes 2–17) constructs is shown in the lower panel. Alternatively spliced products are shown on the left and correspond to numbers shown in panel A. Utilization (percent) of each isoform is shown in the upper panel. Error bars indicate standard deviations of a single transfection experiment in triplicate. (E) Subphysiological temperatures activate cryptic 3′ss +36 and +126 in exon 3 and promotes splicing of intron 1 in the wild-type minigene. The cryptic 3′ss (20) are denoted by arrows in panel A. Relative representation of RNA isoforms 1 and 2 that lack exon 1 was not altered (data not shown), whereas isoforms 5 and 6 were less abundant. (F) Proinsulin secretion by 293T cells following transfection of the wild-type (WT) and mutated constructs 8 and 12. Mutations are shown in panel C.

