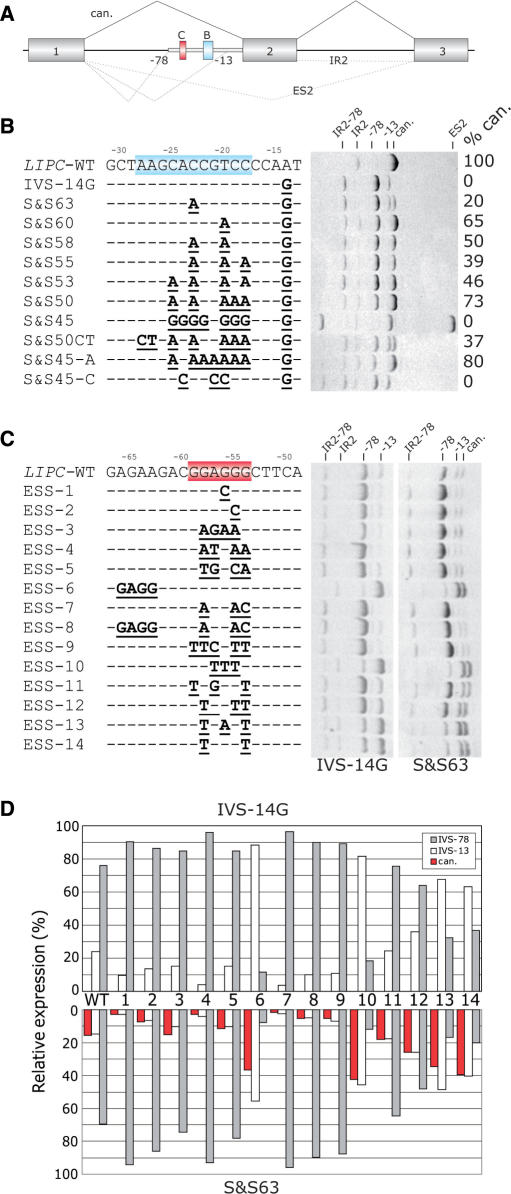
Figure 9.
Silencer-mediated inhibition of intron-proximal 3′ss of LIPC intron 2. (A) Schematic representation of the LIPC splicing reporter. Exons, introns and aberrant splicing patterns are denoted as in Figure 8. Aberrant 3′ss 78 and 13 nt upstream of canonical (can.) 3′ss of intron 1 are designated by numbers. Blue and red boxes indicate sequences shown in panels B and C, respectively. Thick grey line represents an intronic segment retained in the mature mRNA transcribed from constructs carrying mutation IVS1-14A > G. (B) Splicing pattern of LIPC minigenes mutated upstream of the newly created 3′AG (highlighted in blue). Clone designation (S&Sn, where n is the approximate Shapiro–Senapathy score of the aberrant 3′ss 13 nt upstream of the authentic 3′ss) and mutations are shown on the left and the resulting RNA products on the right. The percentage of the canonically spliced isoform is designated with %can. The identity of each RNA product is shown at the top. IR2, retention of intron 2; ES2, skipping of exon 2. (C) Splicing pattern of LIPC minigenes mutated in a putative FAS-ESS (highlighted in red). Clone designation and mutations are shown on the left. RNA products of minigenes −14G and S&S63 (see panel B) are shown on the right. (D) Relative mRNA expression of wild-type (WT) and mutated (ESS1-14) clones lacking intron 2. Canonical products (can.) are shown in red and the amount of splicing to aberrant 3′ss −13 and −78 in white and grey, respectively.

