Figure 5.
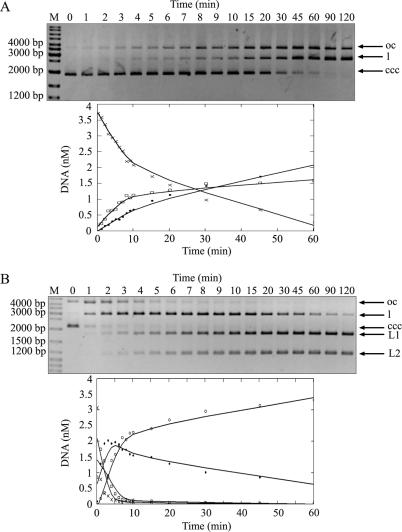
R.NmeDI activity on plasmids with one or two recognition sequences. Reactions were carried out with 0.15 μM of R.NmeDI and 14.2 nM of supercoiled DNAs at 37°C. Aliquots were withdrawn at various times and the reactions were stopped by the addition of 1 μl of phenol and analyzed on 0.8% TBE agarose gel. pUC18 (A) containing one R.NmeDI site and pBluescript KS II (+) (B) containing two R.NmeDI sites were used as a substrate in the reactions. The top panels show agarose gels of time-course series of enzymatic digestion products taken from the reaction. All forms of plasmid DNA: supercoiled (ccc) (×-×), open circle (oc) (□-□), linear (l) (•-•) are marked by arrows. Additionally two linear products of digestion of pBluescript KS II (+) with the enzyme are marked as L1 and L2 (◦-◦). The graphs show the analysis of the data produced by fitting to a first-order rate equation using MathCAD software. The DNA in the substrate and product bands was determined using Gel/ChemiDoc (BioRad) analyzer and quantified with the accompanying software package (Quantity One). The amounts present in individual bands were expressed as a fraction of the total intensity of DNA as visualized by ethidium bromide staining.

