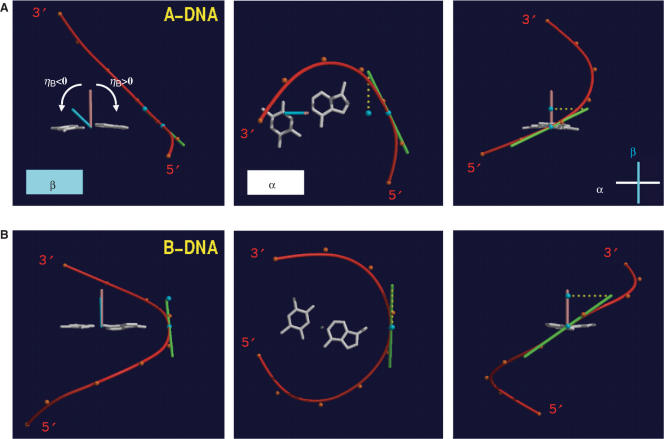
Figure 2.
Definition of the backbone-base pair inclination angle. The relative orientations of a base pair (A–T, white) and the BSpline backbone curve (red) as defined by the phosphorus atoms (orange dots) for (A) A-DNA and (B) B-DNA. The three images each depict projections along the base pair and roughly normal to the WC hydrogen bonds (left), along the normal (brown) to the best plane through the base pair (center), and roughly along the long axis of the base pair (right). For further details see the description of the calculation of the backbone-base inclination angle ηB in the experimental procedures.

