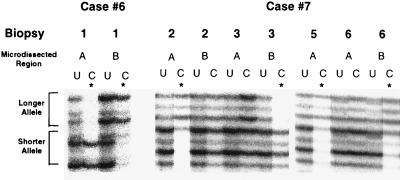
Figure 2.
Clonal analysis of representative KS lesions. The biopsy number and microdissected region of the KS lesions are given above their respective autoradiograph. U, uncut control; C, digested (or cut) with methylation-sensitive restriction enzyme HhaI prior to PCR amplification of the AR gene. The presence of a single AR gene in the digested (C) lane of the KS lesion indicates clonality (e.g., biopsy 2, region A of case 7). The presence of both AR alleles in the digested (C) lane (e.g., biopsy 2, region B of case 7) indicates a polyclonal pattern. Different AR alleles inactivated (e.g., region A and B of case 6; biopsy 2, region A; biopsy 3, region B of case 7) indicate these KS lesions arose independently and are not clonally related either in the same biopsy (case 6) or different biopsies (case 7).

