
Fig. 3.
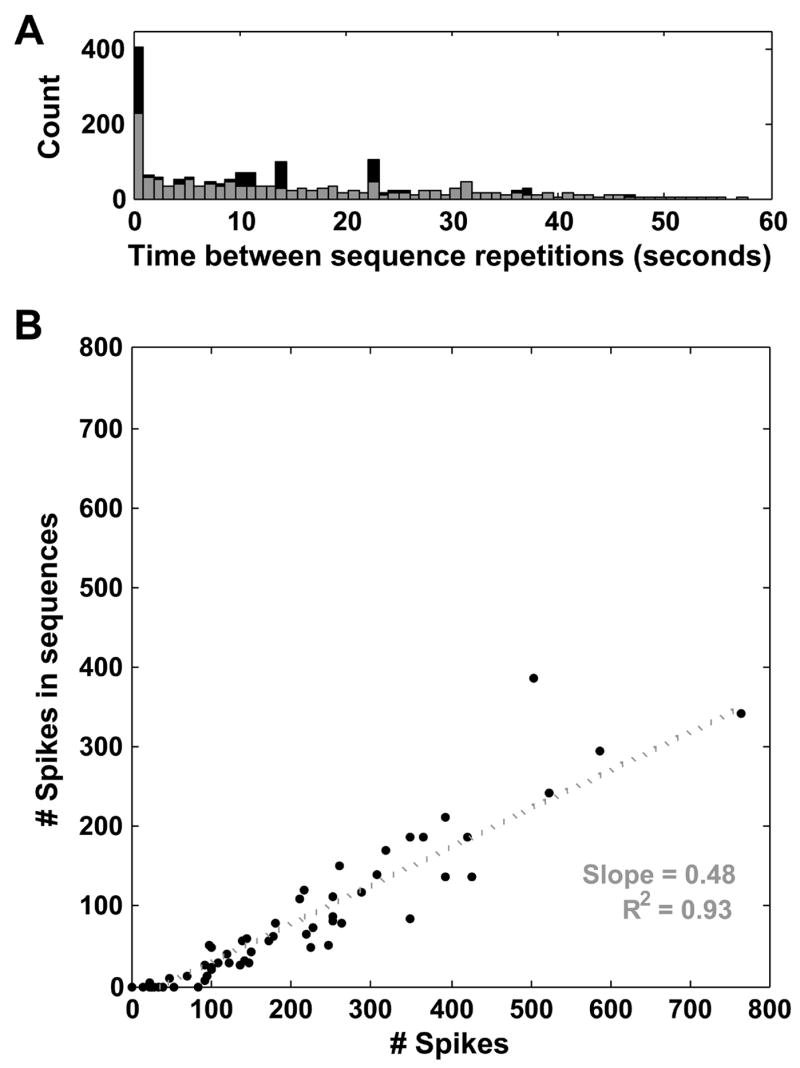
Properties of detected sequences. (A) Histogram of times between sequence repetitions from those sequences repeating three or more times (black bars). Sequences repeated with a mean interval of 13.7 ± 13.0 seconds, though many occur in close succession (left peak of histogram), due to the frequent occurrence of sequences in population bursts (see text). Additional peaks at 14 and 23 seconds are due to bursts in the most active culture studied, which contained three bursts with inter-burst intervals of 14.1 and 23 seconds. The histogram with this culture excluded is shown in gray. (B) Participation of each electrode in sequences, data from one representative culture. The total number of spikes detected on an electrode (x-axis) is plotted vs. the total number of spikes detected on the same electrode that take part in any sequence (y-axis). Each electrode is represented by one point. The slope of the best-fit line through these points can be used to estimate the percentage of spikes taking part in sequences on an electrode, 48% in this culture (R2 = 0.93) (if every spike detected on an electrode participated in a sequence, the best-fit line would have a slope of one).