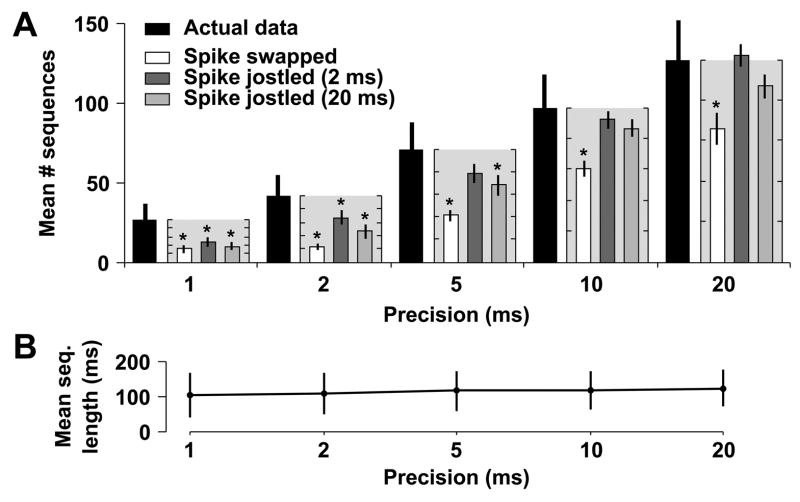
Fig. 4.
Sequences repeat more frequently in actual data from cultures aged 21 DIV than in shuffled data. The template-matching algorithm was run at various precisions (1, 2, 5, 10, and 20 ms) and the number of detected sequences was compared to the number of sequences observed in shuffled versions of the same dataset. (A) The mean number of detected sequence families repeating 3 or more times in the actual data (solid black bars, ±SEM), along with the mean percentage of these sequences explained by shuffled data (spike-swapped white bars; jittered with 2 ms Gaussian kernel dark grey bars; jittered with 20 ms Gaussian kernel light grey bars). Percentages are calculated as the number of sequence families detected in shuffled data divided by the number detected in actual data, and the mean ±SEM of these ratios is plotted (light gray boxes next to black bars of unshuffled data) with the ordinate, ranging from 0–100%, scaled to the number of sequences detected in the actual data. Tick marks are at 20% intervals for these minor axes. Significant differences are indicated by asterisks. (B) Average length (±SD) of sequences repeating three or more times at each precision. The similarity between lengths indicates that our choice of precision does not affect the average length of detected sequences.

