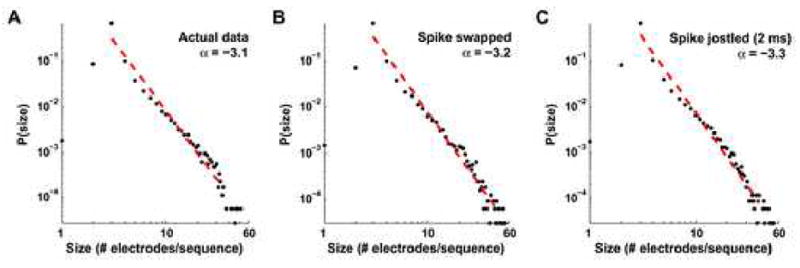
Fig. 7.

The distribution of sequence sizes obeys a power law probability distribution. When the number of electrodes taking part in each detected sequence is graphed against its probability of occurrence, the distribution can be fit by a power law (red dashed line), P(n) ~ n− α, where n is the event size, P(n) is its normalized frequency of occurrence in our datasets, and α is the power law’s exponent. On log-log plots, such as these, graphed power laws appear linear, with slope α. For the observed sequences in the actual data α = −3.1 ± 0.2 (±95% CI, R2 = 0.97; A). However, we find similar scale invariance in our spike-swapped (α = −3.2 ± 0.2, R2 = 0.97; B) and spike-jittered data (α = −3.3 ± 0.2, R2 = 0.97; C), minimizing the importance of scale invariance in explaining our significantly repeating patterns.
