
Figure 7.
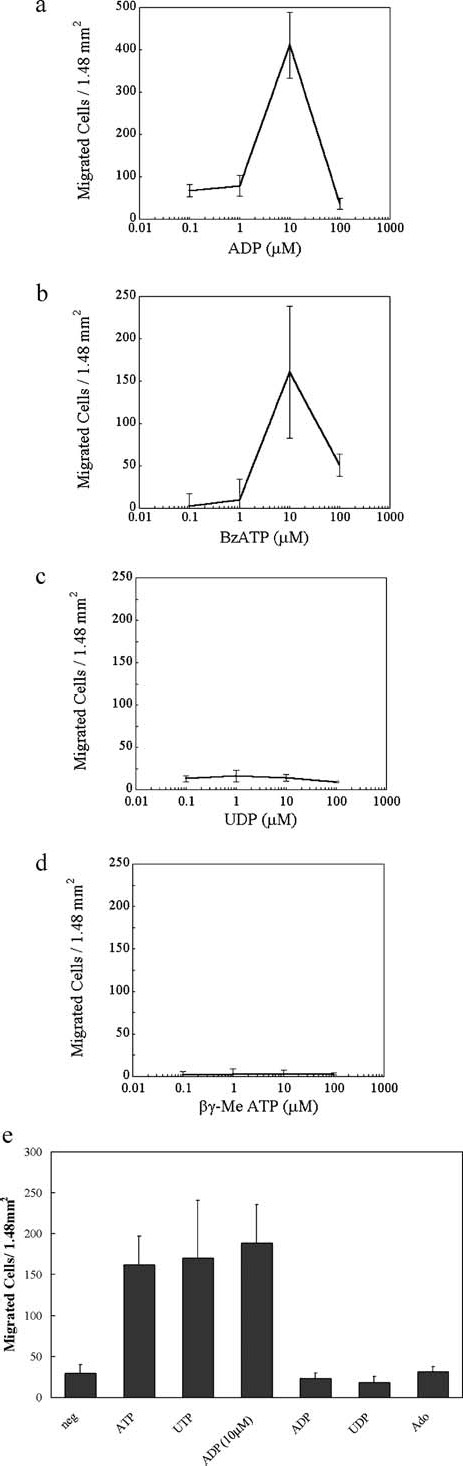
Cell migration is nucleotide specific. Transwell migrations were performed for 8 h at 37 °C with the indicated nucleotide. HCE-T cells were stained with propidium iodide, counted in six randomly chosen fields (1.46 mm2), and averaged. Dose response curves for a) ADP, b) BzATP, c) UDP, and d) β,γ-MeATP are shown. Experiments were performed at least three times and representative curves were chosen. e) Cells were stimulated with binding buffer (neg), 1 µM ATP, UTP, ADP, UDP, or Adenosine (Ado), or 10 µM ADP. Experiments were performed in triplicate.