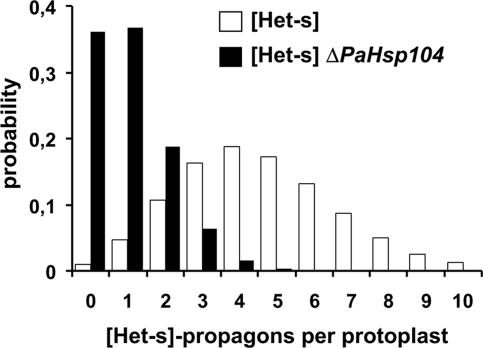
Figure 3.
[Het-s]-propagon numbers per cell in wild-type and ΔPaHsp104. The histogram gives the probability of [Het-s]-propagon numbers per protoplast estimated by applying the Poisson distribution and based on the rate of [Het-s] loss after protoplast regeneration reported in Table 1 (see text for details); □: [Het-s], ■: [Het-s] ΔPaHsp104.

