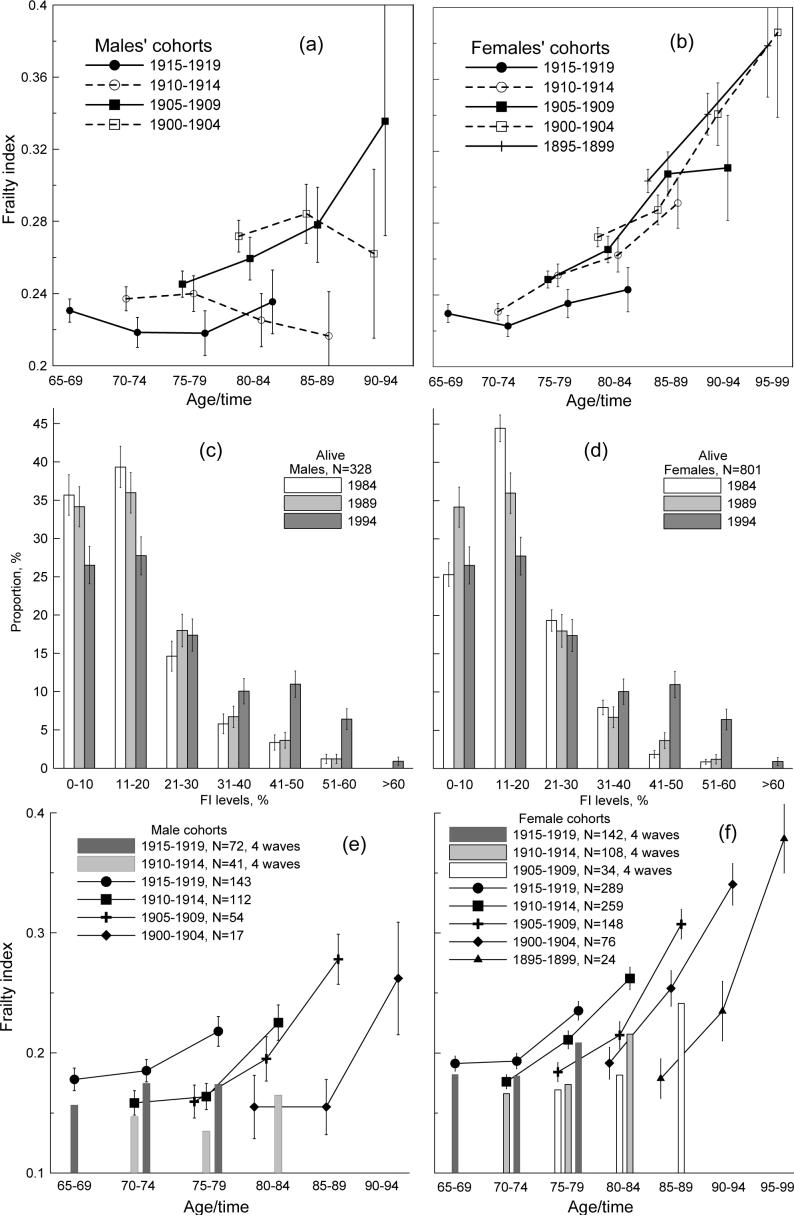
Figure 3.
(a,b) Mean FI for selected 5-year birth cohorts (shown in the figure) of males (a) and females (b) in the 1984, 1989, 1994, and 1999 surveys. (c,d) FI-specific frequency patterns for male (c) and female (d) participants of the 1984, 1989, and 1994 NLTCSs. (e,f) FI dynamics (conditional on survivors) for male and female 5-year birth cohorts participating in three (line plots) and four (bar charts) consecutive surveys starting from the 1984 NLTCS. Thin bars show +/−SE.

