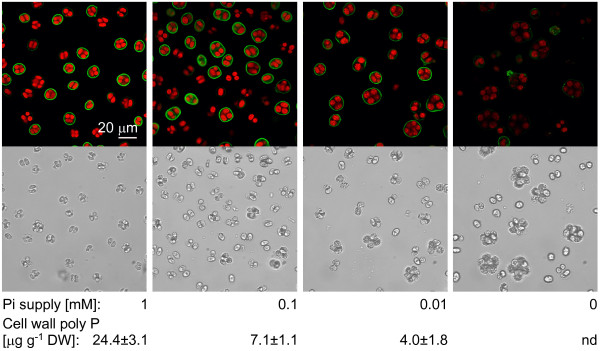
Figure 3.
Correlation of signal intensity and biochemical quantification of cell wall poly P. Wild type (CC-410) cells were grown in TAP medium supplemented with 1, 0.1, 0.01, and 0 mM Pi, stained for cell wall poly P and analysed by confocal microscopy (green: poly P staining, red: chlorophyll, grayscale: corresponding scattered light picture). Cell wall poly P contents indicated below were quantified biochemically by phosphate release form living cells with a specific exopolyphosphatase (ScPpx1).

