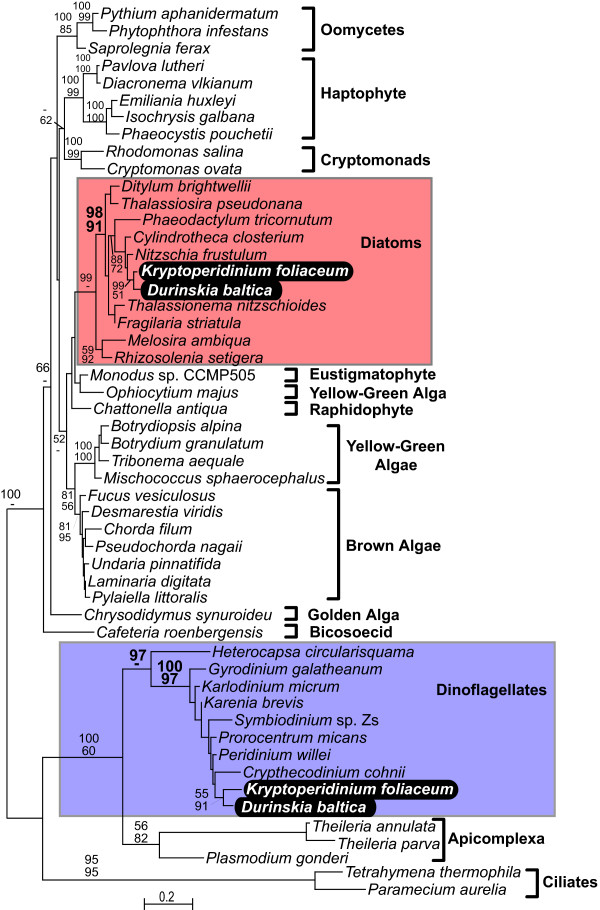
Figure 1.
Protein maximum likelihood phylogeny of cytochrome c oxidase 1 (cox1). Numbers at nodes indicate bootstrap support for major nodes over 50% from ML (top) and distance (bottom). A dash (-) indicates support less than 50%. Major groups are labeled to the right, with diatoms (red) and dinoflagellates (purple) indicated by a box and D. baltica and K. foliaceum genes in black.

