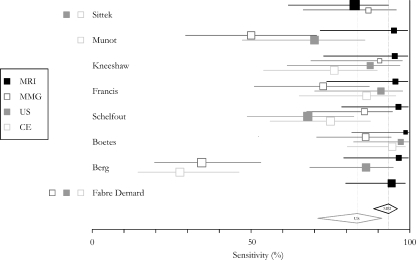
Fig. 1.
Forestplot of the sensitivity of the respective modalities for ILC (MMG mammography, US ultrasound, CE clinical examination), the horizontal lines represent 95% confidence intervals. Modalities presented on the right of the authors name have not been tested in the appropriate study. The diamonds at the bottom represent the pooled estimates and their 95% confidence intervals for MRI and US, respectively. Because mammography and clinical examination were too heterogeneous for meta-analysis no pooled estimate is presented for these modalities

