Fig. 4.

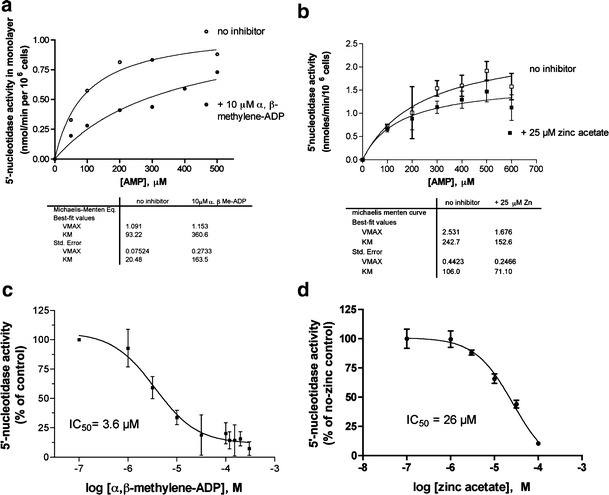
Effect of the 5′-nucleotidase inhibitors on enzyme activity in T84 cell monolayers. a, b Michaelis-Menten curves of enzyme activity vs substrate concentration in the absence (open symbols) and presence (closed symbols) of the inhibitor shown. Enzyme parameters were calculated by nonlinear curve fitting using GraphPad Prism and the fitted parameters of Vmax and KM are shown below the graphs. c, d Dose-response curves for inhibition of ecto-5′-nucleotidase activity by α,β-methylene-ADP (c) and zinc acetate (d) using a 0.2 mM concentration of AMP substrate. In all parts of Fig. 4 the inhibitor was added before the AMP, and in c and d the curves were fitted to a sigmoidal inhibitory dose-response curve and the inhibitory concentration 50% (IC50) value derived from the curve fit is shown
