
Fig. 3.
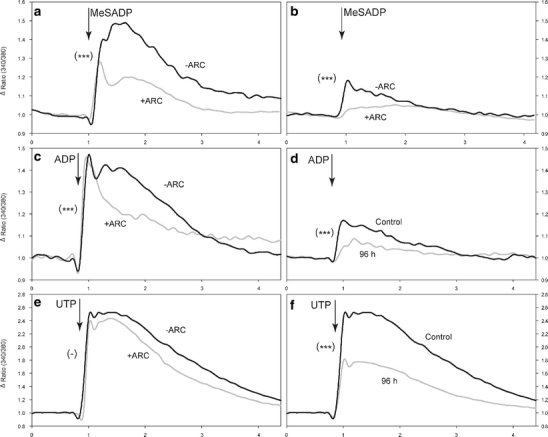
The effect of AR-C69931MX, the P2Y12 receptor antagonist, on Ca2+ signals evoked by 30 μM 2MeSADP (a, b), 10 μM ADP (c, d), and 100 μM UTP (e, f). Black lines represent mean ratio values of Ca2+ responses of cells untreated with P2Y12 antagonist. a, c, e Nonstarved cells, respectively, n = 71, n = 51, n = 73. b, d 96-h serum-starved cells, respectively, n = 79, n = 134. Gray lines in the same panels represent mean ratio value of Ca2+ responses of cells pre-treated for 3 min with 10 μM AR-C69931MX (a, n = 95; b, n = 80; c, n = 19 ; d, n = 175; e, n = 79) and then, while still in its presence, stimulated by agonist, as indicated by arrows. f 100 μM UTP-evoked Ca2+ signals in the control cells (n = 73, black line); and 96-h serum-starved cells, (n = 120, gray line). Each trace represents mean ratio value from five experiments. ***P < 0.001. Statistically insignificant differences are indicated with a minus sign