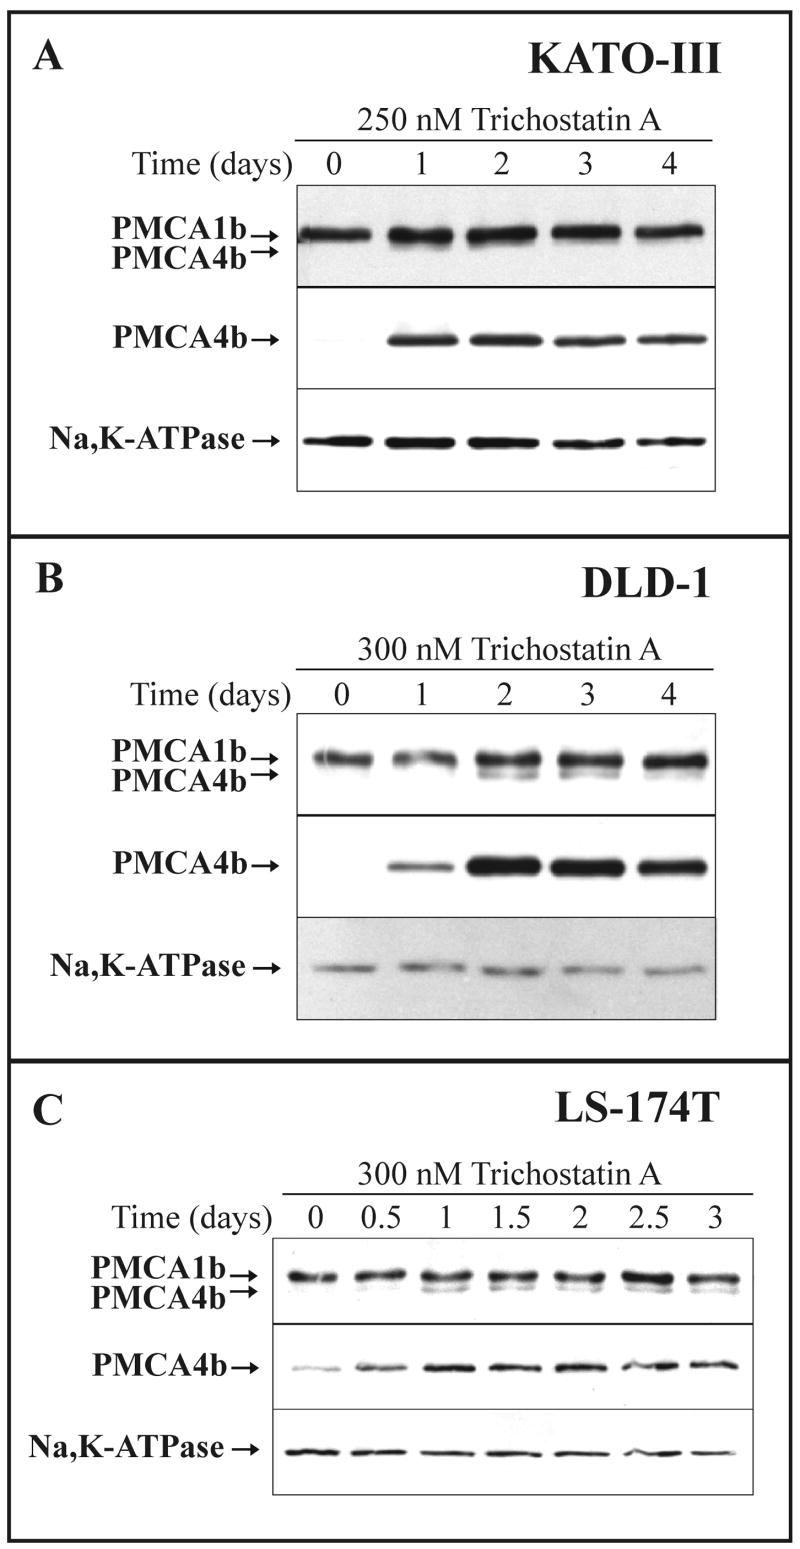
Fig. 8.
Trichostatin A-induced modulation of PMCA expression in various gastric/colon cancer cell lines: time course.
KATO-III (A), DLD-1 (B) and LS-174T (C) cells were treated with the indicated concentrations of trichostatin A for 4 days (KATO-III and DLD-1 cells) or for 3 days (LS-174T cells). Total cellular lysates were prepared at the indicated time points and equal amounts of cellular proteins (from 20 to 30 μg/lane, depending on cell types and the antibody used for immunostaining) were analyzed for overall PMCA (5F10), PMCA4b (JA3) and Na+/K+-ATPase expressions.
The time course of the trichostatin A-induced up-regulation of PMCA4b expression reached a plateau-phase at days 1-2 for KATO-III and LS-174T cells and at days 2-3 for DLD-1 cells.

