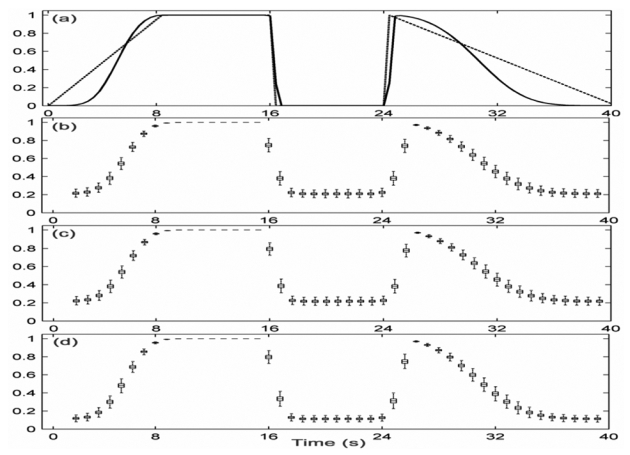
Fig. 2.

Performances of both estimators for model M1 (nonstationary situation, time-varying α[t] for N0 =768. a) Time course of parameter α[t] (dashed line) and target relationship curve (solid line) averaged over frequency axis. Standard boxplots obtained by Monte-Carlo simulation for different estimators: b) |ρ̂[t, f]|2, c) R̂2[t, f] with τM = −τm = 5, d) R̂2[t, f] with τm = τM = 0.
