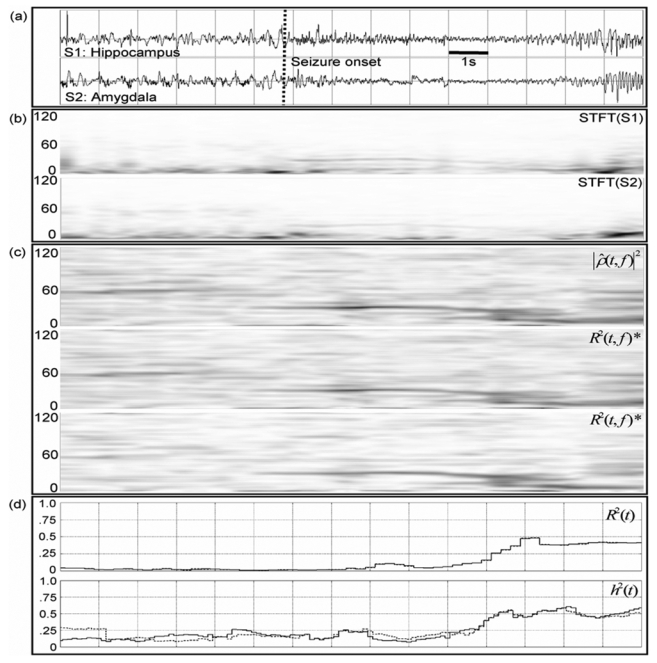
Fig. 4.

Results obtained on real data, a) Two SEEG signals recorded from hippocampus (top) and amygdala (bottom) in an epileptic patient (TLE) and b) corresponding spectrograms, c) Estimated relationship in the time-frequency plane for both methods. (*) Time-frequency representations of R̂2[t, f] maximized for time delay τ (middle, range −20 to 20 ms) and for fixed τ (bottom, τm = τM = 4 ms). d) Estimated relationship by two frequency-independent methods, one linear (r2[t], top) and the other nonlinear (h2[t], bottom).
