Figure 4.
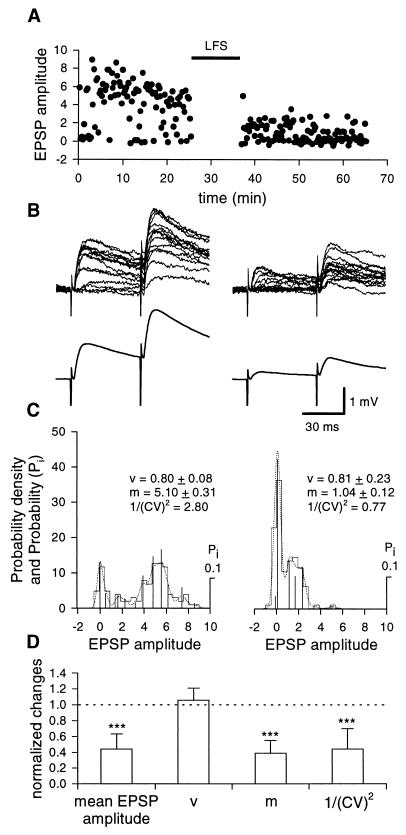
Presynaptic expression of LFS LTD. (A) Plot of EPSPs amplitude (dots) against time, before and after LFS (filled bar) evoked at 0.06 Hz by minimal stimulation of the mossy fibers (representative experiment performed at postnatal day 12 with a patch pipette containing EGTA). (B) Upper traces are superimposed single EPSPs evoked by two stimuli (50 ms apart), before (Left) and 30 min after (Right) LFS. Note the increased number of failures after LFS. Lower traces are the average of all responses evoked before (Left) or after (Right) LFS. (C) Probability density and probability (Pi) calculated by deconvolution analysis of minimal evoked EPSPs, obtained from the representative cell shown in A and B, before (Left) and after (Right) LFS LTD. Deconvolved components are shown by vertical bars; experimental and predictive distributions are represented by the histograms and dotted lines, respectively. (Insets) Estimated quantal size (v), mean quantal content, (m), and the inverse square of the coefficient of variation (1/(CV)2). Numbers of samples were 98 and 102 before and after LFS, respectively. (D) Each column represents the normalized change in mean EPSP amplitude, quantal size, quantal content, and inverse square of the coefficient of variation after LFS LTD in comparison to prestimulus controls obtained in seven cells loaded with EGTA or BAPTA. Bars are SD. ∗∗∗, P < 0.001.

