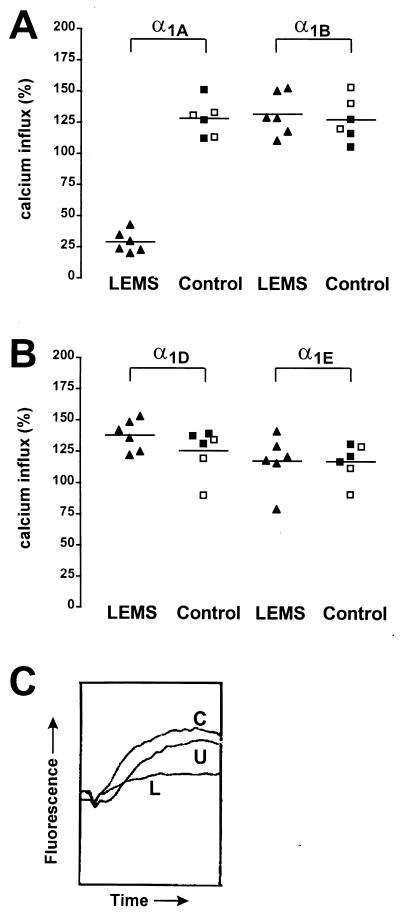
Figure 1.
Effect of LEMS and control IgGs on K+-stimulated [Ca2+]i signals in transfected HEK293 cells. Results are expressed as a percentage of the response in cells incubated in medium alone which was normalized to 100%. The mean results from six LEMS IgGs (▴) are compared with three healthy control IgGs (□) and three disease control IgGs (▪). Each IgG sample was studied in three separate experiments each of six replicates. (A) LEMS IgGs cause a significant reduction in the K+-stimulated calcium influx in the α1A cell line compared with control IgG (P < 0.0001). There was no significant reduction in the α1B cell line. (B) LEMS IgGs caused no significant reduction in calcium influx in the α1D and α1E cell lines. (C) Representative real-time fluorescence traces after K+-stimulated depolarization in the α1A cell line. Incubation with LEMS IgG (L) causes a marked reduction in the rise in fluorescence compared with untreated (U) and control IgG (C) treated cells.

