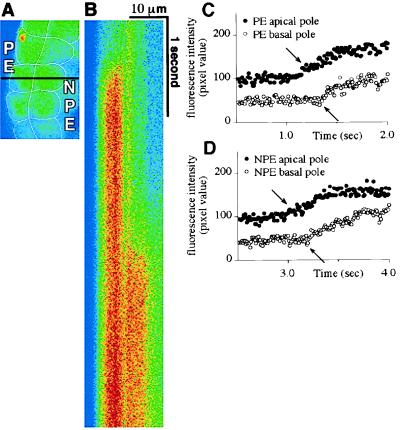
Figure 3.
[Ca2+]i signals begin apically in both the PE and NPE. (A) Confocal microscopic image of a segment of the isolated ciliary bilayer loaded with fluo-3. The confocal line scan in B was performed along the black horizontal line across this image. Note that this line is perpendicular to the bilayer, so it runs from the basal to the apical pole of an NPE and a PE cell. (B) Confocal line scan collected along the line indicated in A during stimulation with 100 μM epinephrine. Fluorescence intensity along the x axis reflects distance (across the scan line) and along the y axis reflects time (between serial scans). Horizontal lines comprising this scan were obtained every 10 ms for a total of 5.12 s (from top to bottom). Note that the [Ca2+]i signal in the PE precedes the signal in the NPE, but the increase in fluorescence in both cells begins apically, then spreads to the opposite (basal) pole. Results are representative of those seen in 10 preparations. (C and D) Graphical representation of the fluorescence intensity over time at an apical and a basal point (represented by closed and open circles, respectively) in the PE (C) and NPE (D) cells that were scanned. The increases in [Ca2+]i (arrows) within the PE cell occur 260 ms apart and the two points are separated by a distance of 6.03 μm, which corresponds to a wave speed of 23.2 μm/s. The increases in [Ca2+]i (arrows) within the NPE cell occur 290 ms apart and the two points are separated by a distance of 6.55 μm, which corresponds to a wave speed of 22.6 μm/s.

