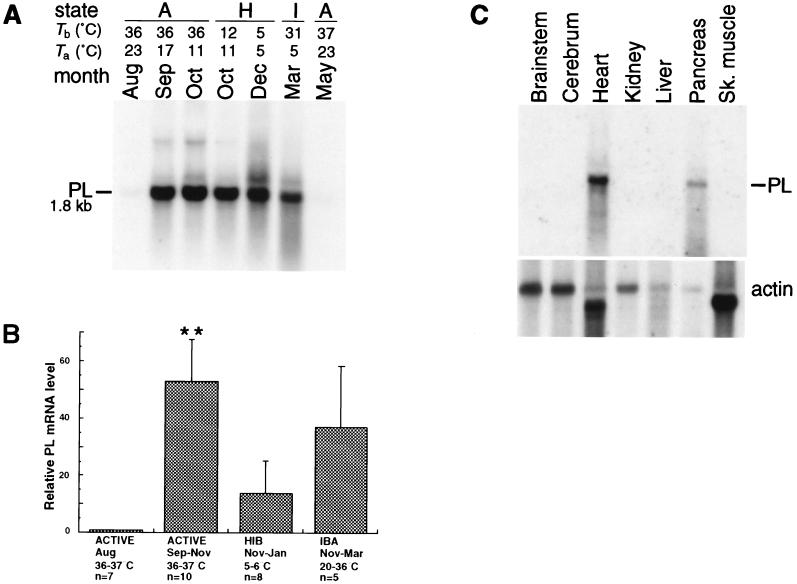
Figure 2.
Expression of PL during the hibernation season. (A) The position and size of heart PL mRNA are indicated. The RNA blot and its actin profile are the same as the one shown in Fig. 1A. (B) Bar graph summarizing PL mRNA levels in the hearts of sibling and nonsibling squirrels captured in Michigan and Illinois. PL mRNA levels were quantified by a PhosphorImager. For each experiment the PL value for the August animal was normalized to 1.00. Each bar represents mean values derived from RNA blot experiments (±SEM). Body temperature, state, month(s) of sacrifice, and the number of animals (n) are indicated below each group. HIB, hibernating; IBA, interbout arousal. Statistically significant comparisons to August mRNA levels were determined by one-way ANOVA: ∗∗, P ≤ 0.01. (C) Tissue distribution of PL mRNA using same blot as shown in Fig. 1C. Tissues are as indicated above each lane and the actin profile for this blot is shown directly below. Sk. muscle, skeletal muscle.

