Figure 4.

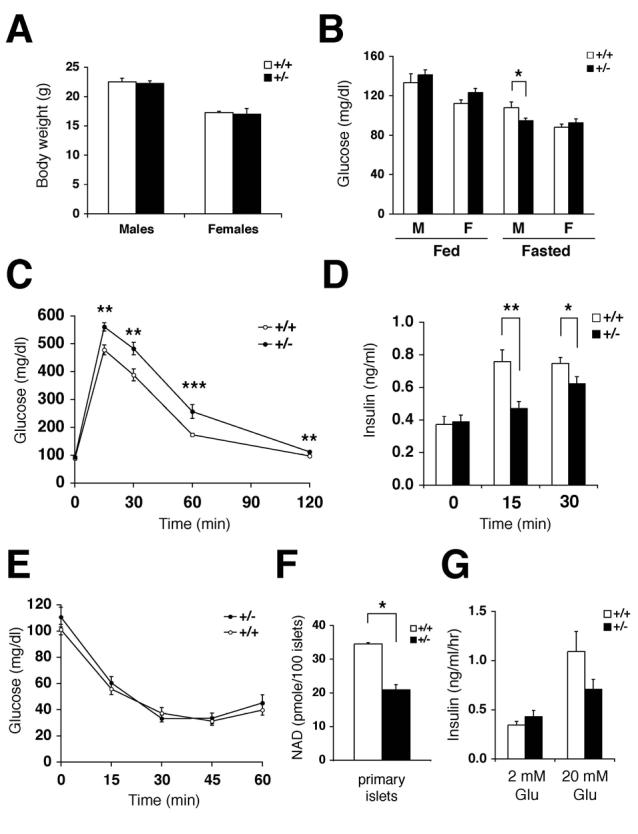
Nampt+/− mice show moderately impaired glucose tolerance and reduced glucose-stimulated insulin secretion. A) Body weights of Nampt+/− and wild-type littermates at 8 weeks of age (n=7-15). B) Fed and fasted glucose levels in males (M) and females (F) of Nampt+/− and control mice (n=10-18). C) Intraperitoneal glucose tolerance tests (IPGTTs). Nampt+/− (n=13) and control (n=18) females were injected with PBS and fasted for 12-14 hrs. Dextrose (3 g/kg body weight) was injected intraperitoneally, and blood glucose levels were measured. D) Plasma insulin levels in Nampt+/− and control female littermates at 0, 15, and 30 min time points in IPGTTs. Nampt+/− mice (n=14), control mice (n=17) for 0 and 30 min time points; Nampt+/− mice (n=7), control mice (n=11) for 15 min time point. E) Insulin tolerance tests (ITTs). Nampt+/− (n=9) and control (n=13) females were injected with human insulin (0.75 U/kg body weight) after fasting for 4 hrs, and blood glucose levels were measured. F) NAD levels (pmole) in primary islets isolated from Nampt+/− and control female mice. NAD levels were measured by HPLC in duplicates of primary islets pooled from three individual mice of each genotype. G) Insulin secreted (ng/ml/hr) from Nampt+/− and control islets at the indicated glucose concentrations (n=4 mice for each genotype). Isolated primary islets were cultured overnight in the RPMI media containing 1 μM nicotinamide prior to insulin secretion experiments.
All results are expressed as mean ± SEM. *p ≤ 0.05, ** p ≤ 0.01, *** p ≤ 0.001.
