Figure 6.
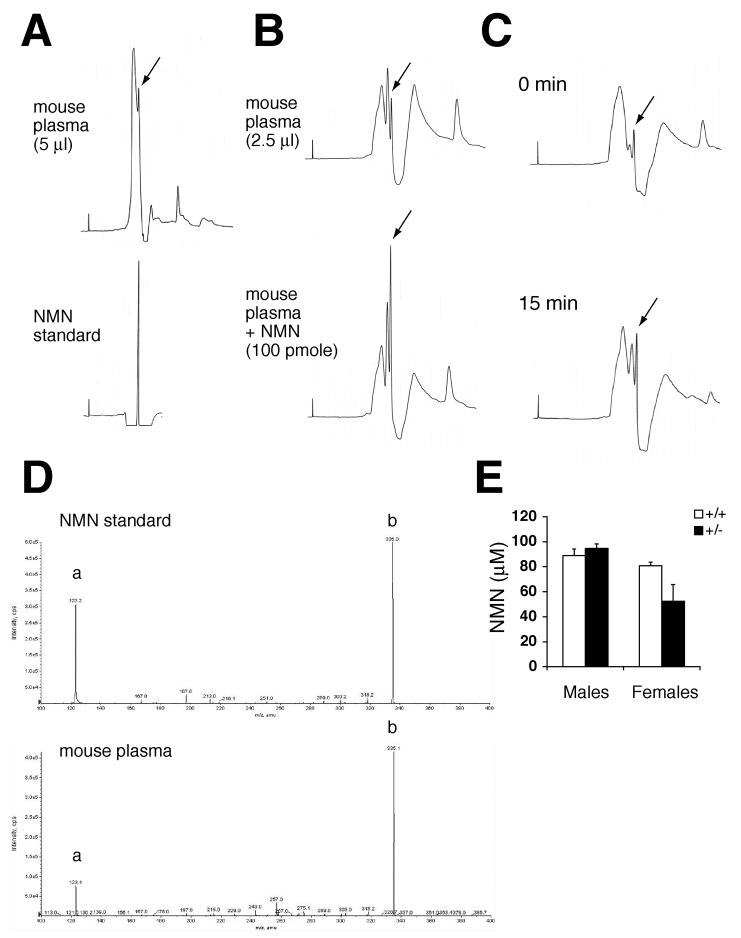
NMN circulates systemically in mouse blood. A) HPLC chromatograms of mouse plasma extracts and standard NMN. The extract that corresponded to 5 μl of plasma and standard NMN were run in an isocratic condition at a flow rate of 1 ml/min. The peak indicated with an arrow showed the same elution time as that of standard NMN. B) HPLC chromatograms of mouse plasma extracts with or without a spike of 100 pmole of NMN. Extracts that corresponded to 2.5 μl of plasma were run at a flow rate of 0.7 ml/min. The peak indicated with arrows showed a significant increase after spiking NMN. C) HPLC chromatograms of mouse plasma extracts at 0 and 15 min time points after NMN injection (500 mg/kg body weight). The peaks indicated by arrows showed an increase at 15 min time point. D) Ion trap tandem mass spectrometry analysis for the fractions that contain the peaks indicated by arrows in HPLC chromatograms. Upper panel, standard NMN; lower panel, the peak fraction of a mouse plasma extract. The signature m/z of 123 (a) and 335 (b) for NMN were detected in the peak fraction. E) Plasma NMN concentrations in control and Nampt+/− male and female mice. The extracts corresponding to 2.5 μl of plasma were analyzed by HPLC, and the NMN peaks were quantitated for control (n=3) and Nampt+/− (n=4) mice at ∼8 months of age. Results are expressed as mean ± SEM.

