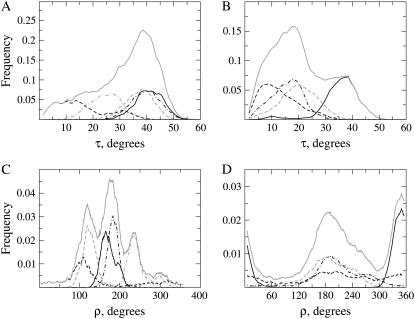
FIGURE 3.
Frequency distributions of orientational parameters. Shown are probability densities of τ (A and B) and ρ (C and D) from peptides WLP23 (A and C) and KLP23 (B and D). The graphs show data from simulations 1 (black, continuous line), 2 (black, dashed line), 3 (black, dashed-dotted line), 4 (shaded, dashed line), and 5 (shaded, dashed-dotted line). Global distributions of orientations found in the complete set of simulations, for each peptide, are drawn as a shaded continuous line.

