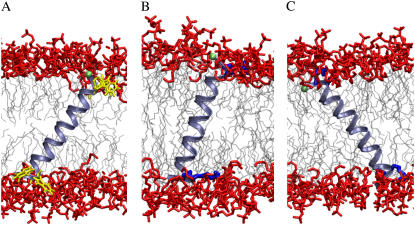
FIGURE 6.
Characteristic structures of peptide-membrane complexes. The models were chosen out of the complete set of trajectories to match the most populated {τ, ρ} pairs (Fig. 5). (A) WLP23 at τ = 38°, ρ = 173°. (B) KLP23 at τ = 18°, ρ = 195°. (C) KLP23 at τ = 37°, ρ = 350°. The lipid acyl tails are depicted in light gray and headgroup atoms are shown in red. The peptides are drawn as light blue ribbons, showing only side chains of anchoring residues, Trp (A) and Lys (B, C), in yellow and dark blue, respectively. The Cα of Gly1, marking the reference for the rotation angle, is shown as a green sphere.

