Abstract
Spider silk is well-known for its outstanding mechanical properties. However, there is a significant variation of these properties in literature and studies analyzing large numbers of silk samples to explain these variations are still lacking. To fill this gap, the following work examines the mechanical properties of major ampullate silk based on a large ensemble of threads from Nephila clavipes and Nephila senegalensis. In addition, the effect of relative humidity (RH) on the mechanical properties was quantified. The large effect of RH on the mechanical properties makes it plausible that the variation in the literature values can to a large extent be attributed to changes in RH. Spider silk's most remarkable property—its high tenacity—remains unchanged. In addition, this work also includes hysteresis as well as relaxation measurements. It is found that the relaxation process is well described by a stretched exponential decay.
INTRODUCTION
Spider dragline silk fibers exhibit unusual mechanical properties, such as a combination of tensile strength and extensibility (1–3). On the contrary, most manmade fibers exhibit either high tensile strength and stiffness or low strength and high extensibility. Many experimental studies have been recently undertaken to explain the mechanical properties based on the macromolecular and supramolecular structural organization of spider silk (4). However, before the structure-property relationship can be quantitatively established, more detailed knowledge is needed of the mechanical properties, e.g., as probed by single fiber stress-strain curves. In particular, not only mean values for mechanical properties such as elastic modulus, breaking strain, and force and/or energy uptake but also the corresponding distribution functions are of interest. Moreover, we must know the dependence on environmental parameters.
Despite the fact that supercontraction of wet dragline fibers along with the corresponding elastomeric stress-strain curves are known (5–8) the influence of relative humidity (RH) has not yet been quantified. Those stress-strain curves of fibers not in direct contact with water are reported to exhibit a sigmoidal shape in some cases (9), while they are described in other studies as being composed of two linear regimes with a yield point in between (10). Theoretical approaches to describe the silk's force-strain curves also neglect the influence of humidity and do not fully reproduce the experimental curves. A simple mathematical model has recently been developed for capture silk (11), but is not applicable for dragline silk, as shown below. Only a molecular dynamics simulation reproduces some of the characteristic features of dragline silk force-strain curves (12). Experimentally, it is necessary to shed more light on the influence of humidity on spider silk's tensile properties by analyzing a statistically relevant number of samples. The dependence on humidity is not only important for a fundamental understanding, but will also have practical implications for possible future material applications of spider silk analogs. In this study, we have determined breaking strain, breaking force, and the energy which a fiber can take before breaking as well as its elastic modulus under different surrounding humidity conditions, using a linear extensometer based on >100 single fiber samples. We have also investigated the silk's repeated hysteresis curves as well as its relaxation behavior.
While the characterization of the mechanical properties is the scope of this work, it is clear that the goal of establishing a structure-property relationship also requires a quantitative investigation of the structural mechanisms underlying the mechanical functions. In other words, one has to address the question which structural elements of spider silk as a high performance biopolymer are responsible for the properties optimized for tensile strength, extensibility, and energy dissipation. To this end, x-ray fiber diffraction (13) has been used to investigate the secondary structure and folding of the silk proteins (spidroins) making up the fiber. A composite structure could be deduced with β-sheet crystallites embedded in an amorphous matrix. In the literature, special attention has been given to dragline fibers of Nephila spiders, e.g., the species N. clavipes NC, N. madagascariensis NM, and N. senegalensis NS. Nephila dragline consists of two proteins: Spidroin I (14) and Spidroin II (15). Both sequences are characterized by repeated blocks of glycine- and alanine-rich motifs, leading to segments with alternating chemical functionality, somewhat similar to synthetic block copolymers. While the shorter alanine blocks are associated with the crystalline fraction consisting of antiparallel β-sheet nano-crystallites, the glycine-rich blocks are likely to form an amorphous matrix (volume fraction of presumably 70–80%), in which the crystallites are embedded similar to synthetic semicrystalline polymers.
The crystallites consist of antiparallel β-pleated sheets with a nearly orthorhombic unit cell (16,17) of 10.6 × 9.44 × 6.95 Å. The short c axis (lattice constant 6.95 Å) is well aligned along the fiber axis while the a and b axes are randomly distributed around the fiber axis (18). The size of the crystallites is very small: values of 53 × 47 × 60 Å(a × b × c) have been determined as an average over different Nephila species (18,19).
MATERIALS AND METHODS
Spider silk
The dragline silk (MAS) of two different spider species (Nephila clavipes and Nephila senegalensis) was investigated in this study. A method of forced silking similar to the one described in Work and Emerson (20) was used to collect the silk threads. Before silking, the spiders were sedated in the refrigerator for 1.5 h at temperatures at ∼3°C. Afterwards they were fixed on a piece of Styrofoam to expose their spinning apparatus. Next, the spinnerets were stimulated with a brush and the dragline threads were selected from the produced silk fibers. Then the two dragline fibers, stemming from neighboring identical glands, were parted from each other and reeled up separately.
Force strain curves
The force-strain curves were obtained using the LEX 810 linear extensometer from Dia-Stron (Dia-Stron, Andover, Hampshire, UK). The instrument is equipped with a load cell (force resolution of 0.049 mN) and a DC motor with optical position control (spatial resolution of 1 μm). For the initial length of the fibers, we chose l0 = 7.5 mm. The speed of extension was vext = 100 μm/sec. The fibers were extended until breaking, which usually occurs at ∼25% of their initial length. The force and the position values were sampled at intervals of 50 ms. Comparable experimental setups and results for force-strain measurements are described in the literature (21,22). For this study, the extensometer was incorporated in an environmental chamber, where different levels of RH could be set. For relative humidities of ∼25% we used a steady flow of nitrogen through the chamber, 44% corresponded to the standard laboratory room conditions, 70% were obtained by a water bath saturated with sodium chloride (NaCl) inside the chamber, and humidities at ∼85% by a pure water reservoir. The relative humidity and the temperature were measured by a model No. 635 sensor (Testo, Lenzkirch, Germany). Note that for a saturated NaCl solution one would expect 75% as the tabulated value for a closed chamber in thermal equilibrium. However, this value was not reached in the chamber used. The measured value is therefore of interest here. All experiments were performed at room temperature.
Scanning electron microscopy
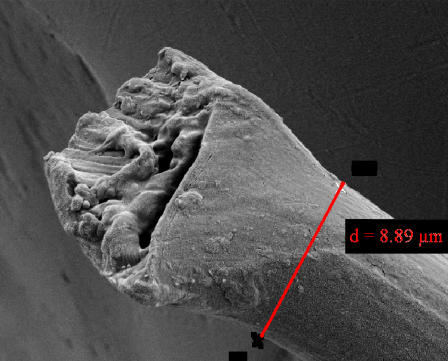
The scanning electron microscopy (SEM) images were taken using a Supra 35 with a resolution of 1.7 nm at 15 kV (Carl Zeiss, Oberkochen, Germany). The high efficiency in-lens detector along with a high-resolution CCD camera allowed for magnifications of up to 500,000 times. Before placing the silk samples into the SEM, they were coated with an ∼14-nm-thin gold layer, which was applied using the sputter coater model No. E 5400, to ensure conductivity of the sample (Polaron Controls, Watford, Hertfordshire, UK).
Data analysis
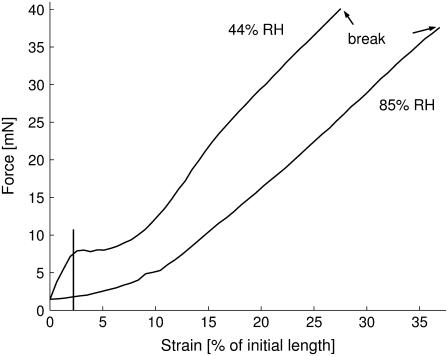
All results shown below are based on analysis of multiple force-strain curves. Two representative curves at different humidities are shown in Fig. 1. The curves were obtained after converting length l, measured in microns, to strain ε = 100 × (l − l0)/l0, given in percent of the fiber's initial length l0. In general, the curves begin with a linear regime. The curves then continue in a linear, a sigmoidal, or a parabolic way leading up to the break point. All curves exhibit a positive slope m ≥ 0 throughout. Therefore, the breaking force FB is the maximum force measured, while the breaking strain εB is the strain corresponding to this maximum force value. The elastic modulus was determined by performing a least-square regression over the initial linear regime, the end of which was determined by eye for each curve. From the resulting slope m the elastic modulus is calculated using E[GPa] = (1/100)·(m[mN/percent]/πr2[μm2]), where r is the radius of the fiber. The energy W, which the fiber can take up before breaking, was determined by numerical integration of the force-length curve using the MatLab routine cumtrapz (The MathWorks, Natick, MA). From this the fiber's tenacity τ, defined as the energy per unit volume V which a fiber can absorb before failing, can be calculated assuming that the fiber has cylindrical shape τ = (W/V) ≈ (W/l0·πr2). The radius r was taken to be the same for each fiber of a given species and was obtained by averaging over several SEM images. The average radius for Nephila clavipes fibers was rNC = 2.43 ± 0.43 μm and rNS = 4.00 ± 0.54 μm for Nephila senegalensis MAS fibers. Note that a possible thinning of the radius with strain was not taken into account, so that the stress corresponds to the so-called engineering stress. For the linear regime and the correspondingly small strain, the difference between engineering stress σ and true stress σT = σ(1 + ε), is smaller than 3–5%, the maximum strain ε of the linear regime. This estimation applies if volume constancy during stretching can be assumed (23). For the measurements, a gauge force FG was set to eliminate noise, ensuring that the measurement would start only after the measured force exceeded a level well above the noise level. Note that the gauge force is the value for the recorded force, which is taken as the criterion for zero extension of the fiber. In other words, the fiber is assumed to be fully extended but not yet under strain as soon as a threshold value (the gauge force) is recorded by the force sensor. If the gauge force is set to a high value, the initial strain is obviously higher than zero, if it is too low, the fiber may not yet be fully extended. We chose FG = 1.5 mN. This gauge force accounts for the small offset in the force-strain curves.
FIGURE 1.
Typical force-strain curves of two Nephila clavipes fibers at 44% and 85% relative humidity. The vertical line indicates the end of the linear regime. The curves are based on over 1000 data points.
RESULTS
Influence of humidity
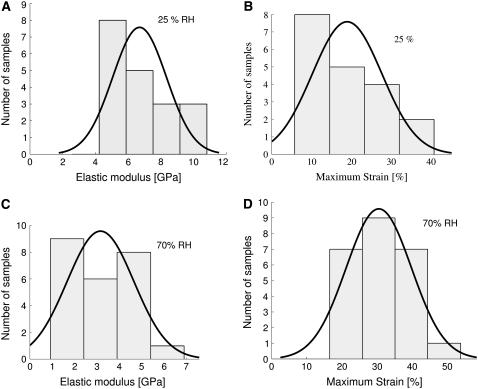
The following analysis is based on 126 single fiber measurements. The precise ensemble sizes at each humidity for Nephila senegalensis are 19 at 25%, 12 at 45%, 25 at 70%, and 14 at 85%. For Nephila clavipes we examined 19 at 25%, 25 at 44%, and 12 at 85% and above. To illustrate the statistical relevance of the ensemble size, histograms for breaking strain and elastic modulus for Nephila senegalensis at 25% and 70% relative humidity are shown in Fig. 2. The four histogram bars are centered at the calculated mean μ of the ensemble, at μ ± σ and at μ ± 2σ, where σ is the standard deviation within the ensemble. For comparison a Gaussian distribution with identical μ and σ normalized to the area underneath the bars is shown. The Gaussian distribution does not always correctly describe the data and it seems that a nonsymmetric distribution with larger probability densities for lower values would describe the data better.
FIGURE 2.
Elastic modulus (above) and strain (below) histograms of two complete Nephila senegalensis ensembles at 25% (left) and 70% (right) relative humidity. For comparison, a Gaussian distribution with the same expectation value μ normalized to the area underneath the bars is shown.
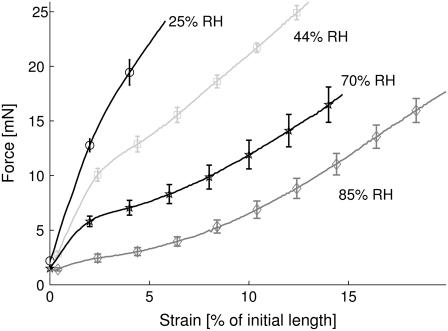
To obtain average force-strain curves at each humidity level, every curve was interpolated using piecewise cubic Hermite interpolation, as implemented in the MatLab routine interp1. This was necessary to calculate the average force values of all curves at the same strain values. These were then plotted up to the point where the weakest fiber of the ensemble tore. The resulting graph for Nephila senegalensis is shown in Fig. 3. The errors shown are the standard deviation σ in the ensemble divided by the square root of the ensemble size N. It can clearly be seen that the shape of the stress-strain curves varies significantly upon changing the surrounding humidity. At relative humidities below 35% the curve consists of two linear regimes. Above 75% RH an elastomeric shape is observed. In the transition region, sigmoidal curves are found. Therefore, all functional forms quoted in literature (9,10) are within the measured humidity range. The averaged values for breaking force, breaking strain, elastic modulus and energy taken before break at different humidities are given in Tables 1 and 2 for Nephila senegalensis and Nephila clavipes, respectively. The breaking force varies little with regard to RH compared to the error within the ensembles. This can be explained by assuming that the fibers break once their amorphous chains tear, since covalent bonds are unaffected by water. The breaking strain increases with rising humidity in a linear way described by the relation εB[%] = (0.29 ± 0.03)·RH + (13.1 ± 1.5). This predicts an extensibility range from 13% to 42% for spider dragline silk. The elastic modulus on the other hand decreases with increasing humidity according to E[GPa] = −(0.185 ± 0.008) × RH + (17.0 ± 0.6). This indicates a maximum elastic modulus of ∼17 GPa and an almost vanishing initial regime for completely wet fibers. The energy taken before break W again seems unaffected by the humidity, which can be explained by the opposing influences of breaking strain and elastic modulus on the energy.
FIGURE 3.
Averaged force-strain curves for Nephila senegalensis ensembles measured at 25%, 44%, 70%, and 85% relative humidity. For clarity, error bars and symbols are shown only at every 20th data point.
TABLE 1.
Comparison of tensile properties for Nephila senegalensis fibers extended at a rate of 0.1 mm/s for different humidities; the errors given are 
| Property | 25% RH | 45% RH | 70% RH | 85% RH |
|---|---|---|---|---|
| FB [mN] | 44.4 ± 2.7 | 40.3 ± 3.6 | 35.3 ± 2.5 | 33.0 ± 3.1 |
| εB [%] | 18.9 ± 2.0 | 24.2 ± 2.8 | 30.6 ± 1.8 | 34.6 ± 2.5 |
| W [μJ] | 40.6 ± 5.7 | 46.0 ± 8.9 | 42.2 ± 4.4 | 39.3 ± 6.4 |
| E [GPa] | 10.5 ± 0.6 | 7.8 ± 0.4 | 5.0 ± 0.5 | 1.4 ± 0.5 |
TABLE 2.
Comparison of tensile properties for Nephila clavipes fibers extended at a rate of 0.1 mm/s for different humidities; the errors given are 
| Property | 25% RH | 44% RH | 80% RH |
|---|---|---|---|
| FB[mN] | 30.0 ± 2.1 | 33.7 ± 1.9 | 36.5 ± 1.4 |
| εB [%] | 22.6 ± 1.2 | 24.6 ± 1.5 | 39.8 ± 1.3 |
| W [μJ] | 32.7 ± 3.0 | 38.0 ± 3.7 | 43.7 ± 2.8 |
| E [GPa] | 13.7 ± 0.7 | 14.0 ± 0.7 | 1.4 ± 0.5 |
An important issue which arises in discussing the results obtained at different RH is the issue of water uptake. To quantify the amount of water absorbed as a function of RH, we have carried out simple control measurements by weighing the mass of dry and humid fibers. Dry fiber bundles were prepared by keeping the sample in vacuum for 24 h before weighing the sample quickly in a balance kept at ambient conditions. Correspondingly, the humid fiber bundles were obtained by tempering the samples in closed chambers with a series of saturated salt solutions. The spider silk was equilibrated for 24 h at 0% (vacuum), 22.5% (Potassium Acetate), 43.2% (Potassium Carbonate), 75.1% (Sodium Chloride), and 97% (Potassium Sulfate) relative humidity. The weight values obtained were m = 0.84, 1.7, 1.89, 1.97, and 2.39 ± 0.15 mg, respectively. A lot of fibers can be described by a volume average over the intrinsic elastic properties and the water content. To analyze the impact of the water content on the elastic properties we have measured the weight of Nephila senegalensis in dependence of the environmental relative humidity. From a linear fit we obtain (weight [%] = 1.097 [± 0.118] + RH × 0.0136 [± 0.002]). This dependency can be taken to renormalize the measured elastic modulus. If such a renormalization is performed the resulting values are not constant but still decaying with RH, indicating that the tensile properties of spider silk cannot be described with a simple volume argument. Note that these measurements are very preliminary and need refinement by more sophisticated instrumentation. However, the results indicate that almost two-thirds of the fiber mass at full hydration is due to water uptake. It is therefore not surprising that the mechanical properties change significantly with RH. A weighted average of the elastic properties of wet and dry silk is, however, too oversimplified to describe the decrease of the elastic modulus.
Comparison with polymer theories
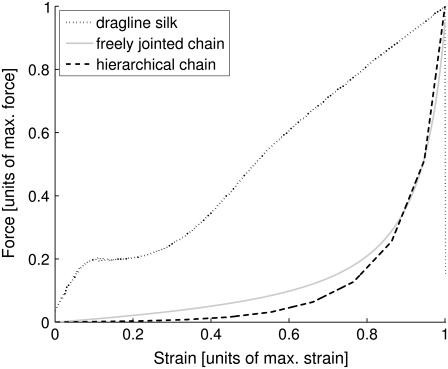
To describe the shape of the measured force-strain curves, one can compare them first with curves resulting from basic polymer theories such as the freely jointed chain (FJC), the freely rotating chain, and the wormlike chain model. While it can be expected that these idealized and oversimplified models cannot describe a highly structured semicrystalline polymer fiber such as spider silk, a comparison illustrating the curve shapes of the simple models and the experimental results, can help to point toward those features in the curve which are intrinsic to spider silk. The resulting plot is shown in Fig. 4. The axes have been normalized to maximum force and maximum strain. The FJC curve is shown for comparison along with the measured curve. Freely rotating and wormlike chain model are not shown due to the great similarity with the FJC curves. As can clearly be seen, the entropic chain model does not reproduce the sigmoidal shape or even the steep initial linear regime of spider silk.
FIGURE 4.
Comparison of a typical measured dragline silk force-strain curve with theoretical curves obtained from freely jointed (N = 109; b = 10−7 m; T = 300 K) and with the predicted curves according to the hierarchical chain model (α = 0.5, β = 2).
Next, let us consider models which have been developed specifically for spider silk, namely the recently published hierarchical chain model (11), as well as the model by Termonia (12). Note, however, that the hierarchical chain model has been developed for capture silk, and not for dragline silk. In contrast to dragline, the capture fibers are characterized by a very small crystalline fraction and a stress-strain curve resembling that of an elastomer. The model best describing the characteristic features of dragline silk force-strain curves is based on a simplified two-component network consisting of entropic chains, and the crystallites of higher elastic modulus, which reinforce the amorphous chains and which act as cross links (12). Unfortunately, the model is quite complicated and can be solved only numerically. It is difficult to derive the minimum ingredients which would already explain the data. A refinement of the model has been given recently (24).
Contrarily, a model with just two parameters and a simple formulation has been proposed recently, the so-called hierarchical chain model (11). This model assumes the fiber to be composed of hmax different hierarchy levels with a given number of submodules mh for each level. It evaluates the following force-strain dependence numerically,
 |
where h is the hierarchy level and mi is the number of subunits in the ith hierarchy level. The force-extension relationship for each level is given by
 |
Here Lh is the relaxed length of a level h submodule, α < 1 is a dimensionless constant, and fh is the force at which the submodule has reached its maximum extension. For each submodule the maximum force before yield increases by a factor of β: Fh+1 = β × Fh (11).
As can clearly be seen, the model does not reproduce the sigmoidal shape or even the steep initial linear regime either. Note that the model has been validated for capture silk. However, the curves of dragline are quite different, as discussed above. To avoid confusion, we also stress that the comparison of the model with capture silk data in (11) is shown on a logarithmic scale, and the initial quasi-linear regime should not be confused with the linear regime in the curve presented here, which is shown on linear scale. Note that the curves shown for different parameters α and β cannot reproduce the experimental curve. Importantly, for no parameter values did we find a curve shaped similar to the experimental one. Spider dragline silk is therefore evidently not described by the hierarchical chain model.
Relaxation
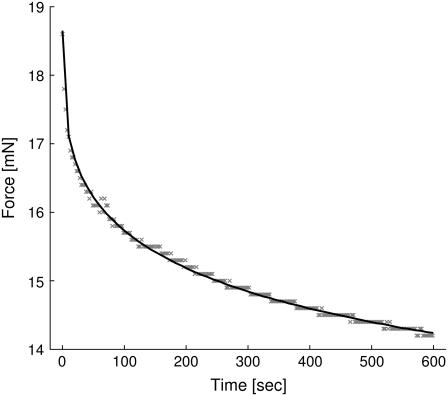
For relaxation measurements, the fiber was extended up to 20% of its initial length and then held in place for 300, 600, 1200 or 1800 s while the decline in force was measured. The corresponding force versus time graph for the entire process is shown in Fig. 5. Due to a large number of different relaxation processes, a stretched exponential function of the form y(t) = F0 + Fr × exp{−(t/τ)β} was used to fit the data. Here, F0 represents the force remaining after completion of relaxation, Fr is the component of the force relaxing to zero in the limit of very large times and τ is the overall averaged relaxation time. The number of relevant relaxation processes influences the value of β. The fitting was performed using the advanced fitting tool of Origin Pro 7.0 (Microcal, Studio City, CA). To calculate the χ2 values of the fit, the linear extensometer's accuracy of 5 · 10−5 N was assigned as error to every data point. The final χ2 values for the nine analyzed data sets range between 0.9 and 5.2 (see Table 3). From the fits it was impossible to obtain a general averaged relaxation time due to a large variation between the data sets. The relaxation parameter β, however, could be determined with reasonable accuracy to β = 0.320 ± 0.033. This is an indication that indeed different relaxation processes and timescales must be involved in the silk's relaxation.
FIGURE 5.
Relaxation curve of a Nephila clavipes fiber extended to 20% of its initial length at 44% relative humidity. The dots are the measured data points, the solid line is the least-square fit obtained by simplex iteration with a deviation of χ2 = 1.10.
TABLE 3.
Results of the stretched exponential fits to our relaxation data; Time refers to the time period over which the decline in force was measured
| Time [s] | τ [s] | β | χ2 |
|---|---|---|---|
| 300 | 37 ± 1 | 0.346 ± 0.004 | 1.12 |
| 600 | 414 ± 29 | 0.306 ± 0.005 | 2.05 |
| 600 | 288 ± 20 | 0.285 ± 0.005 | 5.13 |
| 600 | 696 ± 91 | 0.337 ± 0.008 | 1.10 |
| 600 | 362 ± 23 | 0.315 ± 0.005 | 2.07 |
| 1200 | 240 ± 11 | 0.312 ± 0.005 | 2.79 |
| 1800 | 275 ± 9 | 0.286 ± 0.004 | 0.91 |
| 1800 | 3350 ± 380 | 0.303 ± 0.005 | 1.83 |
| 1800 | 4190 ± 530 | 0.389 ± 0.007 | 2.16 |
Hysteresis
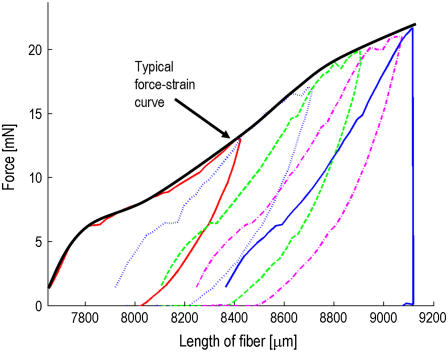
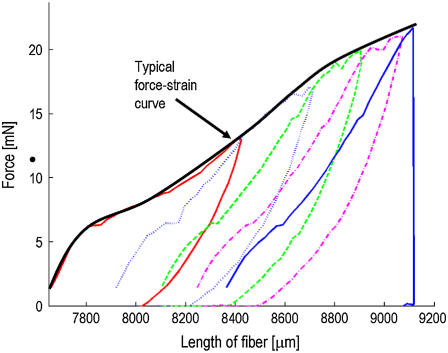
For each sample, up to 10 hysteresis curves were measured followed by a standard measurement until break. To obtain typical hysteresis curves, the gauge force had to be set to zero, which leads to some noise being measured before the actual force-strain curve. An example is shown in Fig. 6. The energy loss percentage, i.e., the energy lost due to deformation of the fiber, for nine fibers measured at 37–44% RH in the very first hysteresis cycle, is 68.0 ± 2.2%. This agrees with values found in literature (2). Not to be found in literature are the repeated hysteresis curves, which look almost identical and show an energy loss of only 37.1 ± 0.9% in the first repeated cycle. This means that the fiber deforms slightly with every repeating cycle, its relaxed length increases very little, and the force necessary to reach full extension declines slowly. To extend the fiber beyond its return point requires more force than has been applied previously. To check this hypothesis, we decided to measure hysteresis cycles with the usual gauge force FG = 1.5 mN. This has the consequence that each cycle starts at the new, relaxed length and extends the fiber more and more until it eventually breaks. Plotting an entire set of repeated hysteresis curves with gauge force in one diagram shows an envelope identical with that of a single measurement until break, as can be seen in Fig. 7. This indicates that the structures resisting extension at a later point are not affected before.
FIGURE 6.
A typical hysteresis measurement cycle for Nephila clavipes at 42% RH without gauge force, including a zoom on the repeated hysteresis curves. The crosses and circles represent the first and the last of the repeated hysteresis cycles, respectively.
FIGURE 7.
Five repeated hysteresis cycles of a Nephila senegalensis fiber at 56% RH with gauge force.
Scanning electron microscopy
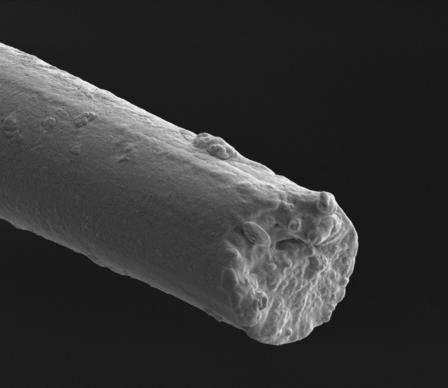
Other than for finding the average radii of the fibers, scanning electron microscopy was used to analyze the tearing profiles of the spider silk samples. A typical profile of a fiber torn by our linear extensometer is shown in Fig. 8. For comparison a fiber cut by hand with a scalpel is shown as well. It is noteworthy that the fiber cut by the scalpel exhibits a doughlike flow behavior while the torn fiber shows a smooth profile. This might be explained by the simultaneous tearing of all amorphous chains in the region, but definitely warrants a more precise analysis.
FIGURE 8.
SEM images of a torn (left) Nephila senegalensis fiber and of one cut by hand with a scalpel (right) at a magnification of 10,000.
DISCUSSION
The influence of humidity is sufficient to explain the great range of mechanical properties and force-strain curves found in the literature. This shows that water can easily permeate into the fiber. It is then incorporated in the amorphous matrix and we assume that this hydration interferes with hydrogen bonds between the amorphous chains (25), which in turn leads to a loss of rigidity.
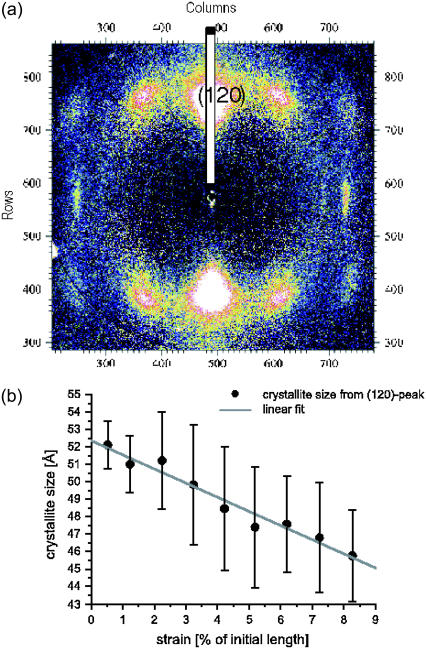
The hysteresis cycles indicate that a silk fiber does not weaken substantially upon repeated loading. Instead, to extend a fiber more than it has been previously extended, a higher force must always be applied. It seems therefore that different structural elements are responsible for the fiber's strength at different elongations (see Fig. 9). Finally, we found that a stretched exponential decay describes the behavior of a silk fiber's relaxation. In particular this means that the relaxation cannot be described as a simple combination of two or three relaxation processes but is more complicated.
FIGURE 9.
(a) Wide angle x-ray diffraction pattern recorded from a single N. madagascariensis fiber at ID13/ESRF. The fiber axis is along the horizontal direction. The pattern can be indexed to an orthorhombic lattice, with the (120) reflection occurring as the strongest peak. A longitudinal cut through the (120) reflection can be analyzed to compute the lateral crystallite width from the Debye-Scherrer formula; see the wide stripe. (b) The resulting values for the crystallite width as a function of strain show a pronounced decrease.
To shed more light on the influence of external stress on internal structure, wide angle x-ray diffraction measurements of single MAS fibers under strain both for dry and hydrated silk have been carried out, and will be subject of a forthcoming publication.
Acknowledgments
We thank Matthias Hahn in taking SEM images.
Financial support by the Deutsche Forschungsgemeinschaft through SFB602/B6 is gratefully acknowledged.
Editor: Michael Edidin.
References
- 1.Vollrath, F., and D. Knight. 2001. Liquid crystalline spinning of spider silk. Nature. 410:541–548. [DOI] [PubMed] [Google Scholar]
- 2.Gosline, J., P. Guerette, C. Ortlepp, and K. Savage. 1999. The mechanical design of spider silks: from fibroin sequence to mechanical function. J. Exp. Biol. 202:3295–3303. [DOI] [PubMed] [Google Scholar]
- 3.Fossey, S., D. Kaplan, and E. J. E. Mark. 1999. Silk protein. In Polymer Data Handbook. Oxford University Press, New York.
- 4.Riekel, C., and F. Vollrath. 2001. Spider silk fiber extrusion: combined wide- and small-angle x-ray microdiffraction experiments. Int. J. Biol. Macromol. 29:203–210. [DOI] [PubMed] [Google Scholar]
- 5.Eles, P., and C. Michal. 2004. Strain dependent local phase transitions observed during controlled supercontraction reveal mechanisms in spider silk. Macromolecules. 37:1342–1345. [Google Scholar]
- 6.Bell, F., I. McEwen, and C. Viney. 2002. Fiber science: supercontraction stress in wet spider dragline. Nature. 416:37. [DOI] [PubMed] [Google Scholar]
- 7.Liu, Y., Z. Shao, and F. Vollrath. 2005. Relationships between supercontraction and mechanical properties of spider silk. Nat. Mater. 4:901–905. [DOI] [PubMed] [Google Scholar]
- 8.Pèrez-Rigueiro, J., M. Elices, G. Plaza, and G. Guinea. 2004. Recovery in spider silk fibers. J. Appl. Polym. Sci. 92:3537–3541. [Google Scholar]
- 9.Ko, F., S. Kawabata, M. Inoue, M. Niwa, S. Fossey, and J. Song. 2002. Engineering properties of spider silk. Mat. Res. Soc. Symp. Proc.
- 10.Porter, D., F. Vollrath, and Z. Shao. 2005. Predicting the mechanical properties of spider silk as a model nanostructured polymer. Eur. Phys. J. E. 16:199–206. [DOI] [PubMed] [Google Scholar]
- 11.Zhou, H., and Y. Zhang. 2005. Hierarchical chain model of spider capture silk elasticity. Phys. Rev. Lett. 94:028104. [DOI] [PubMed] [Google Scholar]
- 12.Termonia, Y. 1994. Molecular modeling of spider silk elasticity. Macromolecules. 27:7378–7381. [Google Scholar]
- 13.Als-Nielsen, J., and D. McMorrow. 2001. Elements of Modern X-Ray Physics. Wiley, Chichester.
- 14.Xu, M., and R. Lewis. 1990. Structure of a protein superfiber: spider dragline silk. Proc. Natl. Acad. Sci. USA. 87:7120–7124. [DOI] [PMC free article] [PubMed] [Google Scholar]
- 15.Hinman, M., and R. Lewis. 1992. Isolation of a clone encoding a second dragline silk fibroin. J. Biol. Chem. 267:19320–19324. [PubMed] [Google Scholar]
- 16.Warwicker, J. 1960. Comparative studies of fibroins. II. The crystal structures of various fibroins. J. Mol. Biol. 2:350–362. [DOI] [PubMed] [Google Scholar]
- 17.Marsh, R., R. Corey, and L. Pauling. 1955. An investigation of the structure of silk fibroin. Biochim. Biophys. Acta. 16:1–34. [DOI] [PubMed] [Google Scholar]
- 18.Glisovic, A., and T. Salditt. 2007. Temperature dependent structure of spider silk by X-ray diffraction. Appl. Phys. A. 87:63–69. [Google Scholar]
- 19.Grubb, D., and L. Jelinski. 1997. Fiber morphology of spider silk: the effects of tensile deformation. Macromolecules. 30:2860–2867. [Google Scholar]
- 20.Work, R., and P. Emerson. 1982. An apparatus and technique for the forcible silking of spiders. J. Arachnol. 10:1–10. [Google Scholar]
- 21.Pèrez-Rigueiro, J., C. Viney, J. Llorca, and M. Elices. 1999. Silkworm silk as an engineering material. J. Appl. Polym. Sci. 70:2439–2447. [Google Scholar]
- 22.Shao, Z., F. Vollrath, J. Sirichaisit, and R. Young. 1999. Analysis of spider silk in native and supercontracted states using Raman spectroscopy. Polym. 40:2493–2500. [Google Scholar]
- 23.Guinea, G. V., J. Pérez-Rigueiro, G. R. Plaza, and M. Elices. 2006. Volume constancy during stretching of spider silk. Biomacromolecules. 7:2173–2177. [DOI] [PubMed] [Google Scholar]
- 24.Vollrath, F., and D. Porter. 2006. Predicting the mechanical properties of spider silk as a model nanostructured polymer. Appl. Phys. A. 82:205. [DOI] [PubMed] [Google Scholar]
- 25.Sapede, D., T. Seydel, V. T. Forsyth, M. Koza, R. Schweins, F. Vollrath, and C. Riekel. 2005. Nanofibrillar structure and molecular mobility in spider dragline silk. Macromolecules. 38:8447–8453. [Google Scholar]


