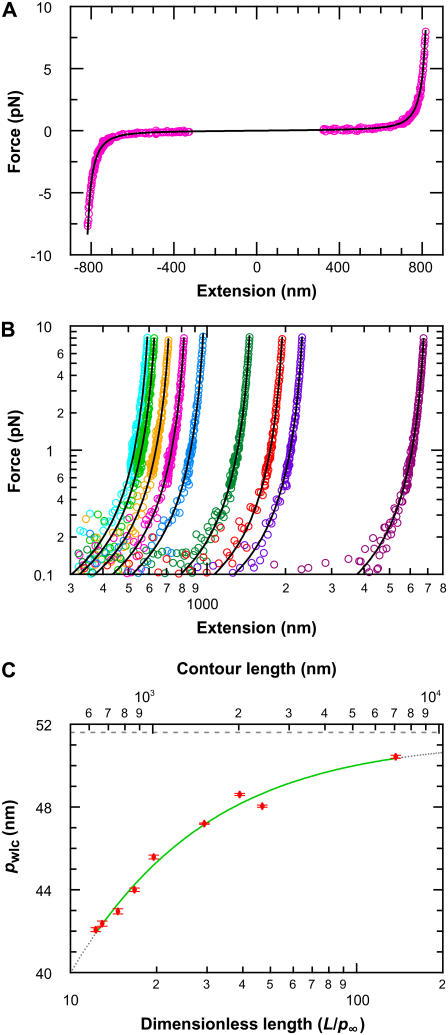
FIGURE 9.
Experimental elasticity results. (A) Elasticity measurement of the 864-nm long DNA tether (magenta) stretched up to 8 pN in the positive and negative direction. A fit to the WLC solution (black) returns three values, pwlc, L, and Δ, where pwlc is the apparent persistence length, L is the contour length, and Δ is the location of the tether point. For the trace shown, the fitted values were 45.0 (±0.6) nm, −0.2 (±0.1) nm, and 863.0 (±0.4) nm, respectively. Data near the origin (1.2 R) are not used in the analysis due to experimental geometric constraints, where R is the radius of the trapped bead. (B) Force-versus-extension traces, with WLC fits, for a range of DNA lengths: 632 nm (lt. blue), 666 nm (lt. green), 756 nm (gold), 864 nm (magenta), 1007 nm (blue), 1514 nm (green), 2013 nm (orange), 2413 nm (purple), and 7030 nm (wine). Only the positive portion of the full records is shown for clarity. (C) Persistence length (mean ± SE) as a function of DNA length (top axis). The fit (green line) represents an empirical approximation to the experimental data over the range of DNA lengths studied where pwlc = p∞/(1 + a p∞/L), p∞ = 51.5 nm (dashed line) is the persistence length for an infinitely long DNA molecule, and a = 2.78. Extrapolation of this curve outside the experimentally tested length range is shown (dotted line). Since pwlc depends on L, we plot pwlc as a function of the number of persistence lengths (L/p∞) by using the length-independent p∞ (bottom axis).

