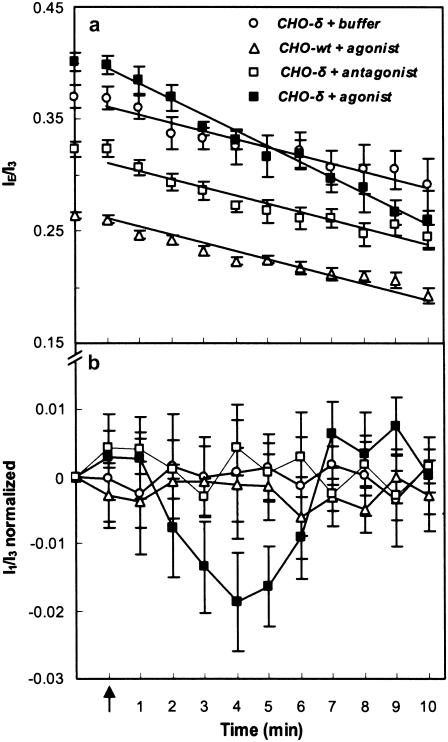
FIGURE 8.
Fluorescence IE/I3 values of one set of various conditions (a) and normalized I1/I3 values for all experiments (b) involving Py-met-chol with living CHO-δ and CHO-wt cell suspensions. The arrow indicates the addition to the CHO-δ cell suspension of a solution of buffer (HEPES, n = 9), antagonist (Diprenorphin, n = 10), or agonist (Deltorphin II, n = 11), or addition of a solution of agonist to the CHO-wt cell suspension (n = 10). I1/I3 ratios are normalized taking ratio values measured before ligand addition. Error bars correspond to mean ± SE of n experiments. Agonist and antagonist were used at final concentrations of 1 μM. All measurements were carried out at 37°C. Lines are provided to facilitate reading.

