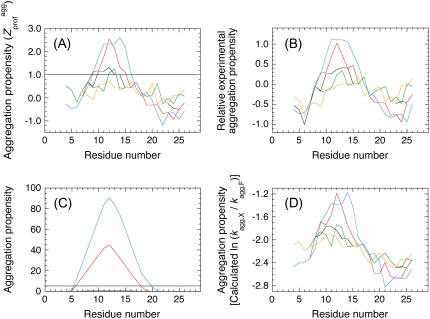
FIGURE 1.
Aggregation propensity profiles of wild-type and scrambled sequence variants of apoMb1-29. The aggregation propensity profiles for panels A–D are calculated according to Pawar et al. (18), Sanchez de Groot et al. (19), Fernandez-Escamilla et al. (12), and Tartaglia et al. (13), respectively. The profiles correspond to wild-type (black), P1 (orange), P2 (green), P3 (red), and P4 (blue) apoMb1-29 variants. In panel C the P1 and P2 variants have aggregation propensity of 0 throughout their sequences.

