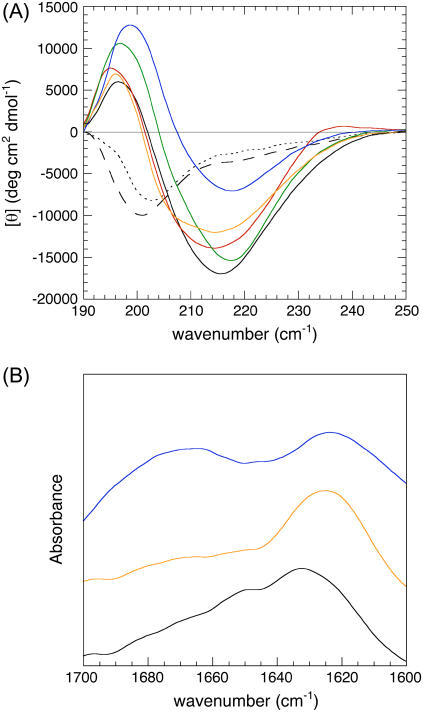
FIGURE 2.
Far-UV CD and FTIR spectra of apoMb1-29 variants. (A) Far-UV CD spectra. (B) FTIR spectra. The spectra refer to wild-type at pH 8.3 immediately after dissolution (black, dashed line), wild-type at pH 2.0 immediately after pH decrease (black, dotted line), wild-type at pH 2.0, and t = 4 days (black, solid line), P1 at pH 2.0 and t = 4 days (orange), P2 at pH 2.0 and t = 4 days (green), P3 at pH 2.0 and t = 4 days (red), and P4 at pH 2.0 and t = 4 days (blue).

