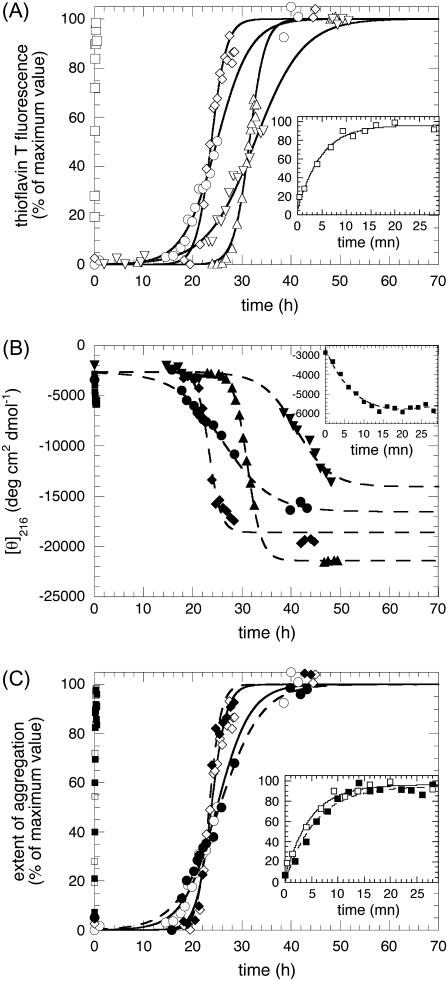
FIGURE 3.
Kinetics of aggregation for apoMb1-29 variants. (A) Aggregation was followed by ThT fluorescence (excitation 440 nm, emission 485 nm). (B) Aggregation was followed by far-UV CD at 216 nm. (C) Comparison of ThT and far-UV CD kinetics of aggregation for three representative variants. In all panels open symbols and solid lines refer to ThT fluorescence data; solid symbols and dashed lines refer to CD data; the kinetic traces correspond to wild-type (circles), P1 (inverted triangles), P2 (triangles), P3 (diamonds), and P4 (squares) apoMb1-29 variants. In all cases the insets show the P4 traces on an extended timescale. In all panels the lines through the data points of the P4 variant represent the best fits to a single exponential function (Eq. 9); the lines through the data points of the wild-type, P1, P2, and P3 variants represent the best fits to a sigmoid function (Eq. 10). The parameters calculated for each variant from these analyses (kagg and tlag) are reported in Table 2.

