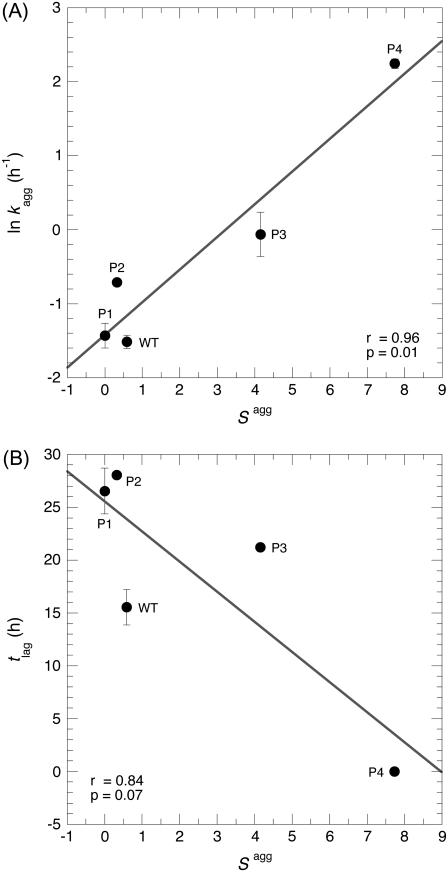
FIGURE 4.
Dependence of the kinetic parameters of aggregation on the Sagg parameter. (A) Correlation between the natural logarithm of the rate constant for the exponential phase (kagg) and Sagg. (B) Correlation between the lag time of aggregation (tlag) and Sagg. Both panels report the mean ± SE on both kagg and tlag, obtained after averaging the ThT fluorescence and CD data reported in Table 2.

