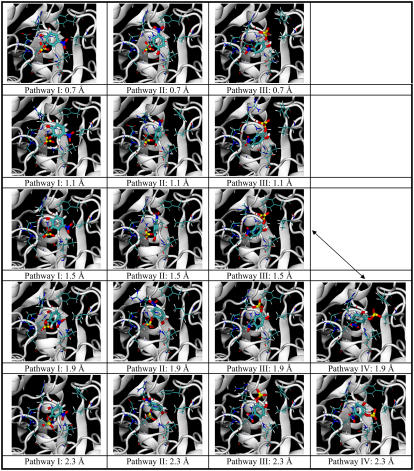
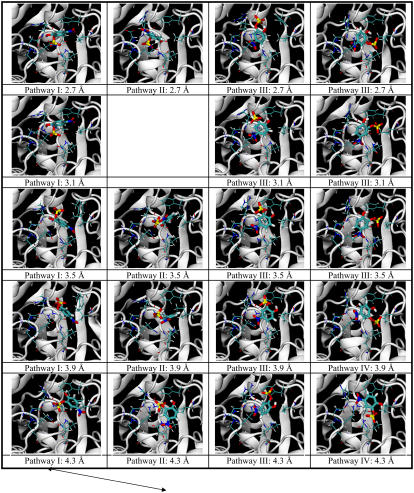
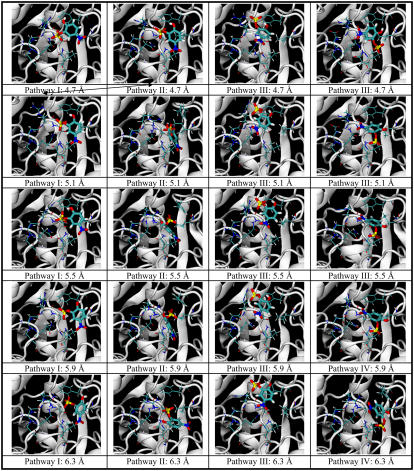
FIGURE 5.
Structural change along four major docking pathways to three different docking poses for 0.7 Å ≤ Rpath ≤ 6.3 Å. pNCS and nine residues (Phe-229, Ile-232, Asp-356, Gln-357, Arg-404, Ala-405, Val-407, Arg-409, and Gln-446) in or near the binding pocket are shown. Pathway I (column 1) leads to the correct docking pose (corresponding to the blue line in Fig. 4). Pathways II, III, and IV (columns 2, 3, and 4) correspond to the yellow, cyan, and green lines in Fig. 3, respectively. The arrows indicate crossing between pathways.


