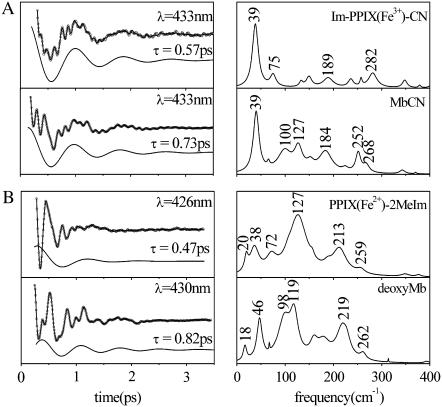
FIGURE 6.
(A) FCS data, fits, and LPSVD power spectra of MbCN and its corresponding model compound. The 39 cm−1 spectral component and its damping time are shown displaced from the data. (B) FCS data, fits, and LPSVD power spectra of deoxyMb and its corresponding model compound. The ∼40 cm−1 spectral component and its damping time are shown displaced from the data.

