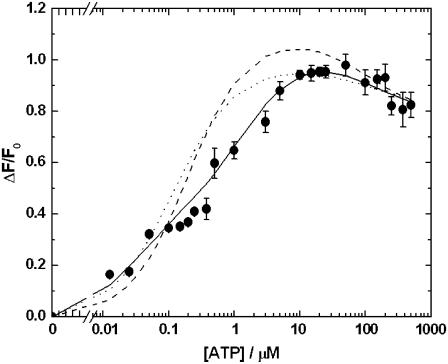
FIGURE 2.
Amplitudes (ΔF/F0) of the observed fluorescence change under the conditions described in Fig. 1 A as a function of the ATP concentration. ΔF is the total fluorescence change (i.e., of both phases if a two-phase signal was observed) and F0 is the initial fluorescence level before mixing with ATP. The dashed line represents the prediction of simulations based on a single-site monomer model (see Fig. 3 a). The dotted line represents the prediction of simulations based on a two-pool enzyme model (see Fig. 3 b). The solid line represents the prediction of simulations based on a dimer model (see Fig. 4). Below ATP concentrations of 0.3 μM, the error bars of the experimental points cannot be seen because they are so small that they are obscured by the symbols used for the points.

