FIGURE 2.
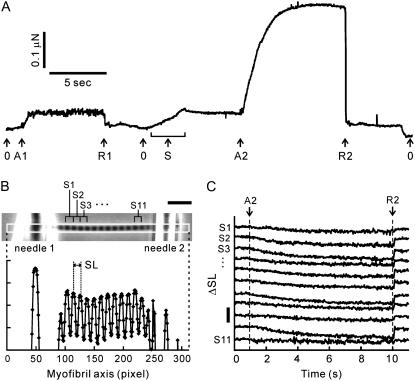
Measurement of the force-SL relationship in myofibrils. (A) The time course of force development obtained from a single myofibril. The myofibril was activated by 6 mM MgADP at A1 and A2, and relaxed at R1 and R2, at average SL 2.35 μm and 2.67 μm, respectively. Arrows with index 0 indicate the zero level of force. The myofibril was stretched under relaxing conditions to adjust SL (arrow S). The large fluctuation of force shown at the first activation (between the arrows A1 and R1) indicates spontaneous oscillation (for details, see text). (B) Phase-contrast image of a single myofibril suspended between a pair of glass microneedles (top) and the corresponding intensity profile along the myofibril axis within the region of interest (white rectangle in the micrograph) (bottom). In this image the solution flow was directed downwards, perpendicular to the long axis of the myofibril. (C) Change in SL (ΔSL) of 11 consecutive sarcomeres during activation. The sarcomere number shown at the left side of each trace corresponds to that in panel B. The time moments indicated as A2 (activation) and R2 (relaxation) correspond to those in panel A. The horizontal scale bar in panel B is 10 μm. The vertical scale bar in panel C is 0.5 μm.

