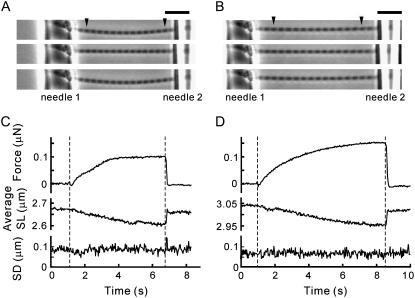
FIGURE 3.
Force and SL behavior at two different SLs under a low level of activation by MgADP. Activations were performed at short (A and C) and medium (B and D) SLs with 1 mM MgATP and 6 mM MgADP in the absence of Ca2+. (A and B) The phase-contrast images of a myofibril from top to bottom were taken during relaxation, at the plateau of force development, and during subsequent relaxation. The individual SLs in the region between the arrowheads were analyzed. Needles 1 and 2 are the stiff and the flexible, respectively. The bowed shape of the myofibril is due to the solution flow. (C and D) The active force (top), the average SL (middle), and the standard deviation of SL distribution (bottom). The period between the two vertical dashed lines indicates the activation. The maximum active force recorded was 30.3 kN/m2 at SL 2.61 μm (A) and 44.1 kN/m2 at SL 2.95 μm (B). The cross-sectional area of the myofibril was 3.02 μm2. Scale bar, 10 μm.

