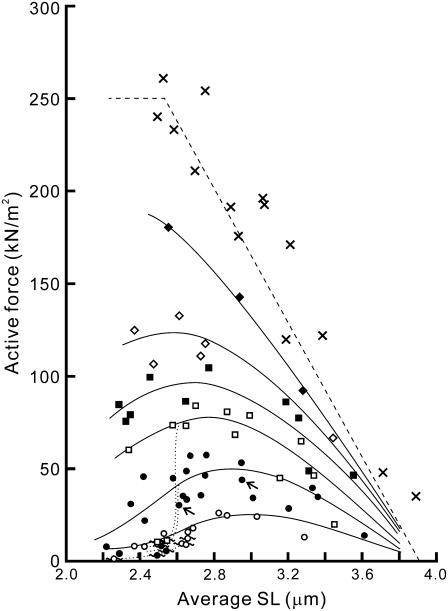
FIGURE 4.
Force-SL relationship at various MgADP concentrations. The active force at the plateau of force development in 4 mM (two myofibrils; ○), 6 mM (four myofibrils; •), 8 mM (three myofibrils; □), 10 mM (three myofibrils; ▪), 14 mM (two myofibrils; ⋄), and 20 mM (one myofibril; ♦) MgADP with 1 mM MgATP in the absence of Ca2+ was plotted against SL. Here, only the average SL is plotted for clarity (for standard deviation showing the homogeneity of SL, see Supplementary Fig. S3 A, Supplementary Material). Spontaneous oscillation of force and SL was sometimes observed at 4, 6, and 8 mM MgADP as shown by symbols with wavy lines. The active force declined when the oscillation occurred, as shown by the dotted lines. Both solid and dotted lines were drawn by eye. The relationship obtained at pCa = 4.5 in the absence of MgADP (three myofibrils) is shown by crosses. The linear dashed line was obtained by assuming that the active force is proportional to the length of overlap between the thick and the thin filaments (the parameters were determined from the electron micrographs (31)). The data are plotted without correction for the rundown of the active force during repeated activations. The data indicated by small arrows correspond to those shown in Fig. 3.

