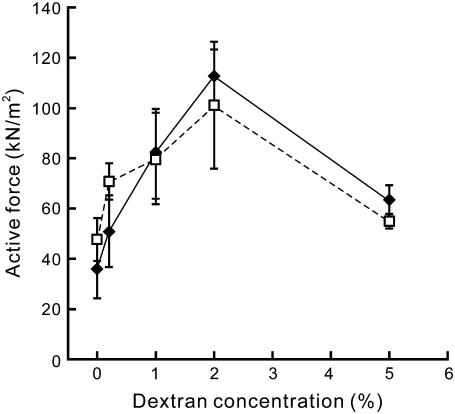
FIGURE 8.
Active force depending on the dextran concentration. The active force was measured at various concentrations of dextran within two regions of SLs, 2.3–2.6 μm (♦, solid line) and 2.7–3.0 μm (□, dashed line), in the presence of 6 mM MgADP and 1 mM MgATP in the absence of Ca2+ (cf. Fig. 7). The active force was averaged within each range of SL, except for the data at which spontaneous oscillation was observed (symbols with wavy lines in Fig. 7). Data points are the mean ± SD (n = 2–8 for each point).

