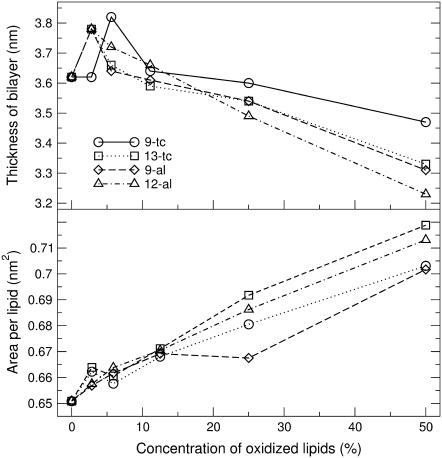
FIGURE 6.
The thickness and area per lipid of lipid bilayer, containing various concentrations of each oxidized lipid. Statistical error estimates are less than the size of the symbols for all the simulations (see Table 5), and are therefore omitted for the sake of clarity.

