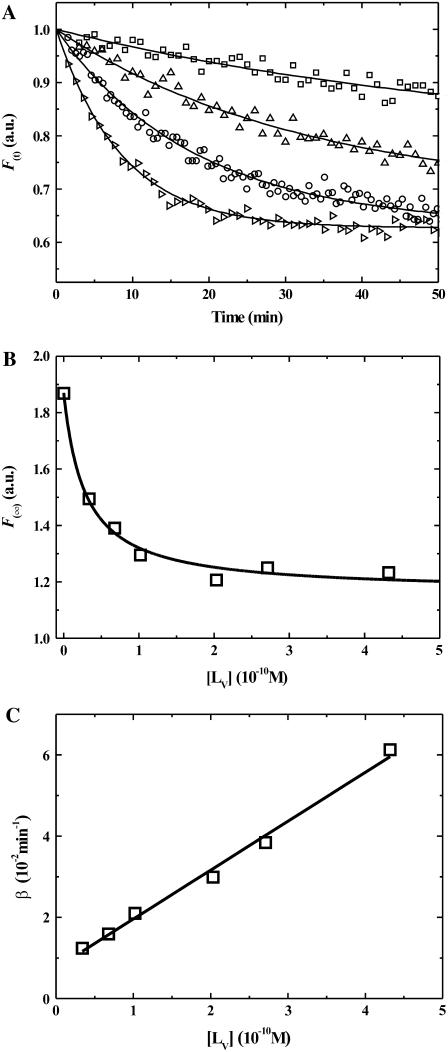
FIGURE 2.
(A) Time course of the association of DHE (2.2 × 10⁻⁷ M) preequilibrated with BSA (2.7 × 10⁻⁴ M) in buffer at pH 7.4, with POPC-Chol LUVs (from top to bottom: 3.4 × 10⁻¹¹, 1.0 × 10⁻¹⁰, 2.7 × 10⁻¹⁰, 4.3 × 10⁻¹⁰) at 25°C. (B) Equilibrium titration of POPC-Chol LUV with DHE previously equilibrated with 2.7 × 10⁻⁴ M BSA. The points are experimental, the line is a theoretical best fit. (C) Dependence of the transfer rate constant, β, upon the LUV concentration, [LV], at 25°C and the best fit of Eq. 6 to the data.

