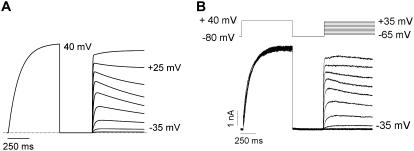
FIGURE 10.
Simulated and experimental observation of dual activation pathways of Kv1.2 channel opening. (A) Traces were generated using the model of Kv1.2 gating (Fig. 9 A). A 600-ms pulse to +40 mV was followed by repolarization to −80 mV for 500 ms and then steps to potentials between −45 mV and +35 mV in 10-mV increments for 600 ms. The model predicts that after the +40 mV conditioning pulse, depolarization to potentials up to +25 mV (i.e., intermediate potentials) should give rise to current traces that activate rapidly and show a slow decay due to transitions from the late “fast” closed state (C4) to the “slow” closed states (C7-C10), whereas depolarizing pulses to potentials >+25 mV should give rise to a fast activating current that is followed by a slow rising current, which is attributed to the opening of the channels that have made the transition from the late “fast” closed states to the “slow” gating state. (B) Experimental currents elicited by the voltage protocol shown above closely replicate the traces generated by the model.

