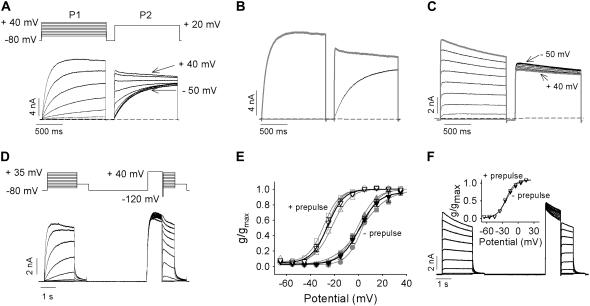
FIGURE 2.
Twin pulses convert “slow” to “fast” activation in Kv1.2. (A) Twin-pulse voltage protocol is shown above, currents below recorded between −50 mV and +40 mV in 10-mV increments for 1.5 s, repolarized to −80 mV for 200 ms, and then depolarized to +20 mV for 1.5 s from a cell exhibiting the “slow” gating mode. Labels on currents refer to the P1 pulse potential. (B) Example of currents from A at +20 mV with (shaded trace) and without (black trace) a prepulse to +40 mV. (C) Ionic currents recorded from a cell exhibiting the “fast” gating mode using the protocol shown in A. The shaded trace depicts the current at +20 mV with a +40 mV prepulse. (D and E) Normalized g-V relations before and after a +40 mV prepulse from cells exhibiting the “slow” gating mode. Original, continuous data shown in D, for pulses between −65 and +35 mV in 10-mV steps obtained using the voltage protocol above. After the first set of voltage steps, the cell was repolarized to −80 mV for 4 s and then given a 1-s prepulse to +40 mV before a 50-ms repolarization to −120 mV and finally the second set of voltage steps. (E) Maximum normalized conductance from three cells obtained for the first (solid symbols) and the second set of steps (open symbols) plotted against membrane potential and fitted with a Boltzmann function. A switch in channel activation gating from “slow” to fast between the first and second set of clamp pulses shifted the mean activation V½ from 1.8 ± 1.5 mV to −25.7 ± 2.0 mV (n = 3). Mean relationships are plotted as black lines and symbols. (F) The effect of a +40 mV prepulse on the g-V relations in cells exhibiting the “fast” gating mode. Ionic traces were recorded using the protocol shown in D. The inset illustrates the average maximum normalized conductance from three cells obtained from the first (solid symbols) and the second set of steps (open symbols) plotted as a function of membrane potential and fitted with a single Boltzmann function. The V½ values were −22.1 ± 0.8 mV and −22.3 ± 1.0 mV for without and with prepulse, respectively.

